This topic provides answers to some frequently asked questions about YARN.
-
Cluster issues
-
How do I check if the ResourceManager service is running properly?
-
What do I do if YARN configuration changes do not take effect?
-
Resource group and queue management
-
Component log management
Why aren't .out logs from YARN service components automatically cleared?
-
Component issues
-
RM
-
NM
-
What do I do if a container fails to start or run with a "No space left on device" error?
-
What do I do if the NM service or a running task cannot resolve domain names?
-
What do I do if changes to the NM resource configuration do not take effect after a restart?
-
How do I handle node disk issues such as "local-dirs are bad" or "log-dirs are bad"?
-
UI or REST API
-
Timeline Server
-
What does a stateful cluster restart constitute?
A stateful cluster restart constitutes a ResourceManager restart and a NodeManager restart. ResourceManager maintains the basic information about and status of applications. NodeManager maintains the information about and status of containers that are running. ResourceManager and NodeManager constantly synchronize their own status to external storage systems such as ZooKeeper, LevelDB, and Hadoop Distributed File System (HDFS). The status of ResourceManager and NodeManager can be automatically reloaded and recovered after they are restarted. This ensures that the status of applications and containers can be automatically recovered after the cluster is upgraded or restarted. In most cases, the upgrade or restart of a cluster is imperceptible to applications and containers.
How do I enable ResourceManager high availability (HA)?
Check or configure the parameters on the Configure tab of the YARN service page of a cluster in the E-MapReduce (EMR) console. The following table describes the parameters.
Parameter | Description |
yarn.resourcemanager.ha.enabled | Specifies whether to enable ResourceManager HA. Set the value to true to enable ResourceManager HA. Default value: false. |
yarn.resourcemanager.ha.automatic-failover.enabled | Specifies whether to enable automatic failover for ResourceManager. Default value: true. |
yarn.resourcemanager.ha.automatic-failover.embedded | Specifies whether to enable embedded automatic failover for ResourceManager. Default value: true. |
yarn.resourcemanager.ha.curator-leader-elector.enabled | Specifies whether to use Curator. Set the value to true to use Curator. Default value: false. |
yarn.resourcemanager.ha.automatic-failover.zk-base-path | The path in which information about a leader is stored. Use the default value /yarn-leader-electionleader-elector. |
How do I configure a hot update?
You can perform the operations in this section only in Hadoop 3.2.0 or later versions.
Configure key parameters.
You can check or configure parameters related to a hot update on the Configure tab of the YARN service page of a cluster in the EMR console. The following table describes the parameters.
Parameter
Description
Recommended value
yarn.scheduler.configuration.store.class
The type of the backing store. If you set this parameter to fs, a file system is used as the backing store.
fs
yarn.scheduler.configuration.max.version
The maximum number of configuration files that can be stored in the file system. Excess configuration files are automatically deleted if the number of configuration files exceeds the value of this parameter.
100
yarn.scheduler.configuration.fs.path
The path in which the capacity-scheduler.xml file is stored.
If you do not configure this parameter, a storage path is automatically created. If no prefix is specified, the relative path of the default file system is used as the storage path.
/yarn/<Cluster name>/scheduler/conf
ImportantReplace <Cluster name> with a specific cluster name. Multiple clusters for which the YARN service is deployed may use the same distributed storage.
View configurations of the capacity-scheduler.xml file.
Method 1 (RESTful API): Access a URL in the following format: http://<rm-address>/ws/v1/cluster/scheduler-conf.
Method 2 (HDFS): Access the configuration path ${yarn.scheduler.configuration.fs.path}/capacity-scheduler.xml.<timestamp> to view configurations of the capacity-scheduler.xml file. <timestamp> indicates the time at which the capacity-scheduler.xml file is generated. The capacity-scheduler.xml file that has the largest timestamp value is the latest configuration file.
Update the configurations.
For example, you can modify the parameter yarn.scheduler.capacity.maximum-am-resource-percent and delete the parameter yarn.scheduler.capacity.xxx. To delete a parameter, you need to only remove the value field of the parameter.
curl -X PUT -H "Content-type: application/json" 'http://<rm-address>/ws/v1/cluster/scheduler-conf' -d '
{
  "global-updates": [
    {
      "entry": [{
        "key":"yarn.scheduler.capacity.maximum-am-resource-percent",
        "value":"0.2"
      },{
        "key":"yarn.scheduler.capacity.xxx"
      }]
    }
  ]
}'
How do I handle the uneven distribution of resources among applications in a queue?
You can perform the operations in this section only in Hadoop 2.8.0 or later versions.
In most cases, resources in a queue are occupied by large jobs, and small jobs fail to obtain sufficient resources. To ensure an even distribution of resources among jobs, perform the following steps:
Change the value of the yarn.scheduler.capacity.<queue-path>.ordering-policy parameter from the default value fifo to fair for a queue.
NoteFirst in, first out (FIFO) scheduler and fair scheduler are two types of schedulers in YARN.
You can also modify the parameter yarn.scheduler.capacity.<queue-path>.ordering-policy.fair.enable-size-based-weight. The default value of this parameter is false, which specifies that jobs are sorted by resource usage in ascending order. If you set the parameter to true, jobs are sorted by the quotient of resource usage divided by resource demand in ascending order.
Enable intra-queue resource preemption.
The following table describes the parameters that are used to control intra-queue resource preemption.
Parameter
Description
Recommended value
yarn.resourcemanager.scheduler.monitor.enable
Specifies whether to enable preemption. This parameter is configured on the yarn-site tab. Other parameters related to queue resource preemption are configured on the capacity-scheduler tab.
true
yarn.resourcemanager.monitor.capacity.preemption.intra-queue-preemption.enabled
Specifies whether to enable intra-queue resource preemption. Inter-queue resource preemption is enabled by default and cannot be disabled.
true
yarn.resourcemanager.monitor.capacity.preemption.intra-queue-preemption.preemption-order-policy
The policy based on which the intra-queue resource preemption is performed. Default value: userlimit_first.
priority_first
yarn.scheduler.capacity.<queue-path>.disable_preemption
Specifies whether to disable resource preemption for the specified queue. Default value: false.
If you set the parameter to true, the resources of the specified queue cannot be preempted. If this parameter is not configured for a child queue, the child queue inherits the configuration of this parameter from the parent queue.
true
yarn.scheduler.capacity.<queue-path>.intra-queue-preemption.disable_preemption
Specifies whether to disable intra-queue resource preemption for the specified queue. Default value: false.
If you set the parameter to true, intra-queue resource preemption is disabled. If this parameter is not configured for a child queue, the child queue inherits the configuration of this parameter from the parent queue.
true
View queue resource usage
To view queue resource usage, check Used Capacity on the YARN UI. This value shows the percentage of a queue's resources currently in use, calculated as the higher of memory and vCore usage.
-
Access the YARN UI. For details, see Access the web UIs of open source components.
-
On the All Applications page, click the ID of the target job.
-
Click the queue in the Queue row.
The Application Queues section displays the queue resource usage.
The queue details include parameters such as Queue State, Used Capacity, Configured Capacity, Configured Max Capacity, Effective Capacity, Absolute Used Capacity, and Used Resources. The Used Capacity parameter indicates current resource usage, for example,
<memory:896, vCores:1> (10.9%).
YARN .out log file accumulation
-
Cause: Some Hadoop dependency libraries use Java Logging APIs to generate logs, bypassing log4j rotation settings. The standard error (stderr) from these daemons is redirected to
.outfiles. Without automatic cleanup, these files accumulate and can fill up the data disk. -
Solution: Use the
headandtailcommands with log timestamps to check whether these Java API logs are consuming excessive disk space. These logs are typically at the INFO level and do not affect component functionality. To prevent disk exhaustion, you can disable this logging.For example, to optimize the Timeline Server by disabling logging from the Jersey dependency library, follow these steps:
-
Run the following command to monitor the
.outlog files related tohadoop-timelineserver-in the YARN log path. The log path is/var/log/emr/yarn/for a DataLake cluster and/mnt/disk1/log/hadoop-yarnfor a Hadoop cluster.tail /var/log/emr/yarn/*-hadoop-timelineserver-*.outThe log output shows records from the
com.sun.jerseycomponent.xxx com.sun.jersey.server.wadl.generators.AbstractWadlGeneratorGrammarGenerator attachTypes INFO: Couldn't find grammar element for class javax.ws.rs.core.Response xxx com.sun.jersey.server.wadl.generators.AbstractWadlGeneratorGrammarGenerator attachTypes INFO: Couldn't find grammar element for class javax.ws.rs.core.Response xxx com.sun.jersey.server.wadl.generators.AbstractWadlGeneratorGrammarGenerator attachTypes INFO: Couldn't find grammar element for class javax.ws.rs.core.Response com.sun.jersey.server.wadl.generators.AbstractWadlGeneratorGrammarGenerator attachTypes INFO: Couldn't find grammar element for class javax.ws.rs.core.Response xxx com.sun.jersey.server.wadl.generators.AbstractWadlGeneratorGrammarGenerator attachTypes INFO: Couldn't find grammar element for class javax.ws.rs.core.Response xxx com.sun.jersey.server.wadl.generators.AbstractWadlGeneratorGrammarGenerator attachTypes INFO: Couldn't find grammar element for class javax.ws.rs.core.Response -
To disable INFO-level logs from the Jersey library, create a configuration file. On the EMR node that hosts the Timeline Server, run the following command as the root user to create the file.
sudo su root -c "echo 'com.sun.jersey.level = OFF' > $HADOOP_CONF_DIR/off-logging.properties" -
In the EMR console, go to the Configure tab for the YARN service. Find the
YARN_TIMELINESERVER_OPTSparameter (oryarn_timelineserver_optsfor a Hadoop cluster) and append-Djava.util.logging.config.file=off-logging.propertiesto its value. -
Save the configuration and restart the Timeline Server for the change to take effect. Monitor the service. If the Timeline Server starts successfully and its
.outlog no longer shows messages fromcom.sun.jersey, you have successfully disabled the logging.
-
How do I check whether the ResourceManager service is normal?
You can use one of the following methods to check whether the service is normal:
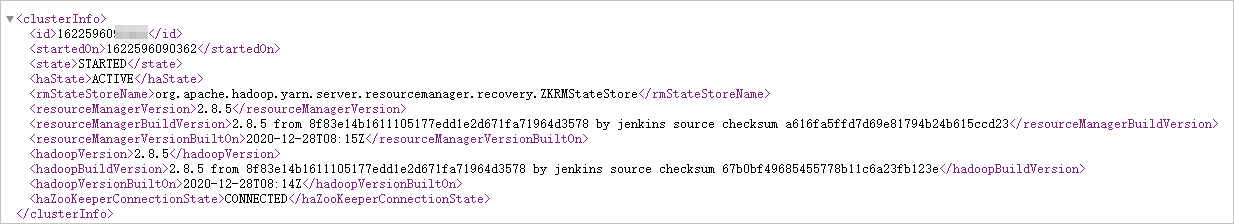
Check the ResourceManager HA status. In an HA cluster, make sure that only one ResourceManager process is in the Active state. You can use one of the following methods to check whether the value of the haState field is ACTIVE or STANDBY, and whether the value of the haZooKeeperConnectionState field is CONNECTED. The status of ResourceManager HA is determined based on the values of the haState and haZooKeeperConnectionState fields.
Command-line interface (CLI): Run the yarn rmadmin -getAllServiceState command.
RESTful API: Access a URL in the http://<rmAddress>/ws/v1/cluster/info format.
Sample code
Check the status of YARN applications.
Run the following command to check whether applications are stuck in the submitted or accepted state:
yarn application -listCheck whether the submitted new application can run and stop running as expected. Sample command:
hadoop jar <hadoop_home>/share/hadoop/mapreduce/hadoop-mapreduce-client-jobclient-*-tests.jar sleep -m 1 -mt 1000 -r 0You can add a parameter whose name is -Dmapreduce.job.queuename between sleep and -m to specify a queue. The default value of the added parameter is
default.
How do I obtain the status of an application?
You can view the following information about an application to obtain the status of the application.
Information | Description |
Basic information | The basic information about an application includes ID, User, Name, Application Type, State, Queue, App-Priority, StartTime, FinishTime, FinalStatus, Running Containers, Allocated CPU VCores, Allocated Memory MB, and Diagnostics. You can view the basic information about an application on one of the following pages or by using one of the following methods:
|
Queue information |
|
Container logs |
|
Application troubleshooting
-
Check the application state on the application details page or by using the application REST API.
-
Application state not found. Possible causes include:
-
The client process terminated before submitting the application to YARN. This may indicate an issue with a client-side component, such as BRS or flowagent. Check the client submission logs.
-
The client cannot connect to the YARN ResourceManager. Verify that the ResourceManager address is correct and that there are no network issues. A network problem can result in the following error on the client:
com.aliyun.emr.flow.agent.common.exceptions.EmrFlowException: ###[E40001,RESOURCE_MANAGER]: Failed to access to resource manager, cause: The stream is closed.
-
-
NEW_SAVING: In this state, the application information is being written to the ZooKeeper state store. If the application remains in this state, possible causes include:
-
An issue with ZooKeeper. Check if the ZooKeeper service is running properly.
-
A problem with reading data from or writing data to ZooKeeper. For the solution, see What do I do if the ResourceManager is in the Standby state and cannot automatically switch to the Active state?
-
-
SUBMITTED: This state is rare. A possible cause is that the Capacity Scheduler is blocked due to lock contention from too many node update requests. This typically occurs in large-scale clusters and requires process optimization. For a related case, see YARN-9618.
-
ACCEPTED: Check the Diagnostics. Take the appropriate action based on the message provided.
-
Error message: "Queue's AM resource limit exceeded."
-
Possible cause: The sum of used ApplicationMaster (AM) resources and the requested AM resources exceeds the queue's limit for AM resources. The condition checked in the UI is: ${Used Application Master Resources} + ${AM Resource Request} < ${Max Application Master Resources}.
-
Solution: Increase the AM resource limit for the queue. For example, set the yarn.scheduler.capacity.<queue-path>.maximum-am-resource-percent parameter to 0.5.
-
-
Error message: "User's AM resource limit exceeded."
-
Possible cause: The sum of the AM resources used by the user and the requested AM resources exceeds the per-user AM resource limit for the queue.
-
Solution: Increase the user-limit ratio. You can modify the values of the yarn.scheduler.capacity.<queue-path>.user-limit-factor and yarn.scheduler.capacity.<queue-path>.minimum-user-limit-percent parameters.
-
-
Error message: "AM container is launched, waiting for AM container to Register with RM."
-
Possible cause: The ApplicationMaster has started, but its internal initialization is not complete, for example, due to a ZooKeeper connection timeout.
-
Solution: Examine the ApplicationMaster logs.
-
-
Error message: "Application is Activated, waiting for resources to be assigned for AM."
Proceed to Step 3 to investigate why the ApplicationMaster resource request is not being met.
-
-
RUNNING: Proceed to Step 2 to check if the container resource requests have been met.
-
FAILED: Check the diagnostics. Take the appropriate action based on the message provided.
-
Error message: "Maximum system application limit reached,cannot accept submission of application"
-
Possible cause: The total number of running applications in the cluster has exceeded the configured limit (parameter: yarn.scheduler.capacity.maximum-applications, default value: 10000).
-
Solution: Check JMX metrics to verify that each queue has the expected number of running applications. Identify and address any applications causing excessive repeated submissions. If all applications are legitimate, consider increasing this configuration value based on the cluster's workload.
-
-
Error message: "Application XXX submitted by user YYY to unknown queue: ZZZ"
-
Possible cause: The application was submitted to a queue that does not exist.
-
Solution: Submit the application to an existing leaf queue.
-
-
Error message: "Application XXX submitted by user YYY to non-leaf queue: ZZZ"
-
Possible cause: The application was submitted to a parent queue.
-
Solution: Submit the application to an existing leaf queue.
-
-
Error message: "Queue XXX is STOPPED. Cannot accept submission of application: YYY"
-
Possible cause: The application was submitted to a STOPPED or DRAINING queue. A queue in these states is offline or being decommissioned.
-
Solution: Submit the application to a queue in the RUNNING state.
-
-
Error message: "Queue XXX already has YYY applications, cannot accept submission of application: ZZZ"
-
Possible cause: The number of applications in the queue has reached its limit.
-
Solution:
-
Investigate whether any problematic applications are being submitted repeatedly to the queue.
-
Adjust the configuration:
yarn.scheduler.capacity.<queue-path>.maximum-applications.
-
-
-
Error message: "Queue XXX already has YYY applications from user ZZZ cannot accept submission of application: AAA"
-
Possible cause: The number of applications from the user has reached its limit.
-
Solution:
-
Check if the user is repeatedly submitting a problematic application.
-
Adjust the following configuration parameters:
yarn.scheduler.capacity.<queue-path>.maximum-applications,yarn.scheduler.capacity.<queue-path>.minimum-user-limit-percent, andyarn.scheduler.capacity.<queue-path>.user-limit-factor.
-
-
-
-
-
Check if YARN resource allocation is incomplete.
-
On the applications list page, click an application ID to navigate to its details page.
-
In the list at the bottom of the page, click the AM-ID to open the App Attempt page.
-
Check the Total Outstanding Resource Requests list for pending resources. Alternatively, query for them with the PendingRequests REST API.
-
No pending resources: This indicates that YARN has completed the allocation. Exit this check and investigate the ApplicationMaster. When no pending resources exist, the Total Outstanding Resource Requests section shows 0 for all metrics (for example,
memory:0, vCores:0), and the resource request table below is empty. This table includes columns such as Priority, ResourceName, Capability, and NumContainers. -
Pending resources exist: This indicates that YARN resource allocation is not complete. Continue to the next step.
-
-
-
Check resource limits.
Check cluster or queue resources. View resource information such as Effective Max Resource and Used Resources.
-
Check if the resources of the cluster, the queue, or its parent queue are exhausted.
-
Check if any resource dimension in the leaf queue is approaching or has reached its limit.
-
When cluster resource utilization is high (for example, above 85%), application allocation speed may decrease. This can happen because most nodes have no available resources. When a node cannot satisfy a resource request, the scheduler may reserve the request. A large number of reservations can slow down the allocation process. This issue can also be caused by an imbalance between memory and CPU resources. For example, some nodes may have available memory but no available CPU, while others have available CPU but no available memory.
-
-
Check if containers fail to start even after their resources are allocated. The App Attempt page in the YARN web UI shows the number of allocated containers. Observe this number for a short period to see if it changes. If a container fails to start, check the corresponding NodeManager or container logs to investigate the failure.
-
Dynamically change the log level. Go to the Log Level page in the YARN web UI (http://RM_IP:8088/logLevel). In the Class Name field, enter the target class name (for example, a class in the
org.apache.hadoop.yarn.server.resourcemanager.schedulerpackage, such asorg.apache.hadoop.yarn.server.resourcemanager.scheduler.capacity). In the Level drop-down list, selectDEBUG, and then click Set Log Level. This dynamically sets the log level for the specified class to DEBUG.ImportantEnable DEBUG logging only while you are reproducing the issue. A duration of less than a minute is typically sufficient, as logs are generated very quickly. After you capture the necessary logs, set the log level back to INFO.
Parameters for maximum available resources
The following scheduler or queue parameters determine the maximum available resources.
|
Parameter |
Description |
Default |
|
yarn.scheduler.maximum-allocation-mb |
The maximum memory in MB that can be allocated for a container at the cluster level. |
In E-MapReduce, the default is the available memory of the largest non-master node group specified during cluster creation. This value matches the yarn.nodemanager.resource.memory-mb setting for that node group. |
|
yarn.scheduler.maximum-allocation-vcores |
The maximum number of vCores that can be allocated for a container at the cluster level. |
In E-MapReduce, the default is 32. |
|
yarn.scheduler.capacity.<queue-path>.maximum-allocation-mb |
The maximum memory in MB that can be allocated for a container in a specific queue. |
Not configured by default. If set, this value overrides the cluster-level setting and applies only to the specified queue. |
|
yarn.scheduler.capacity.<queue-path>.maximum-allocation-vcores |
The maximum number of vCores that can be allocated for a container in a specific queue. |
Not configured by default. If set, this value overrides the cluster-level setting and applies only to the specified queue. |
If a resource request exceeds the maximum allocation for a task or container, the system records the InvalidResourceRequestException: Invalid resource request… exception in the application logs.
YARN configuration changes not taking effect
-
Possible causes
-
For configurations that do not support hot updates, the associated component was not restarted.
-
For configurations that support hot updates, the required action was not performed.
-
-
Solution: After modifying a configuration, perform the correct follow-up actions.
Configuration file
Type
Actions
-
capacity-scheduler.xml
-
fair-scheduler.xml
Scheduler configuration
Run the refresh_queues operation on ResourceManager.
-
yarn-env.sh
-
yarn-site.xml
-
mapred-env.sh
-
mapred-site.xml
YARN component runtime configuration
Restart the associated component. For example:
-
If you modify a parameter such as YARN_RESOURCEMANAGER_HEAPSIZE in the yarn-env.sh file or yarn.resourcemanager.nodes.exclude-path in the yarn-site.xml file, you must restart ResourceManager.
-
If you modify a parameter such as YARN_NODEMANAGER_HEAPSIZE in the yarn-env.sh file or yarn.nodemanager.log-dirs in the yarn-site.xml file, you must restart NodeManager.
-
If you modify a parameter such as MAPRED_HISTORYSERVER_OPTS in the mapred-env.sh file or mapreduce.jobhistory.http.policys in the mapred-site.xml file, you must restart MRHistoryServer.
-
What do I do if the following error message is reported for an exception that occurs on an application client: Exception while invoking getClusterNodes of class ApplicationClientProtocolPBClientImpl over rm2 after 1 fail over attempts. Trying to fail over immediately?
Problem description: The active ResourceManager cannot be accessed. The ResourceManager logs contain the following exception information: WARN org.apache.hadoop.ipc.Server: Incorrect header or version mismatch from 10.33.**.**:53144 got version 6 expected version 9.
Cause: An early version of Hadoop is used. The version of remote procedure call (RPC) used by the application client is incompatible with the Hadoop version.
Solution: Use Hadoop of a version that is compatible with the application client of the RPC version.
What do I do if ResourceManager cannot automatically switch from the Standby state to the Active state?
You can use one of the following methods to troubleshoot the issue:
Check whether the parameters that are used to enable automatic status recovery are correctly configured. The parameters must be configured as described in the following table.
Parameter
Description
yarn.resourcemanager.ha.enabled
Set the value to true.
yarn.resourcemanager.ha.automatic-failover.enabled
Set the value to true.
yarn.resourcemanager.ha.automatic-failover.embedded
Set the value to true.
If the issue persists after you set the preceding parameters to true, use one of the following methods to further troubleshoot the issue:
Check whether the ZooKeeper service is normal.
Check whether the data that is read by the ZooKeeper client (ResourceManager) exceeds the upper limit of the ResourceManager buffer.
Problem description: The ResourceManager logs contain the following exception information: Zookeeper error len*** is out of range! or Unreasonable length = ***.
Solution: On the Configure tab of the YARN service page of a cluster in the EMR console, click the yarn-env tab and set the yarn_resourcemanager_opts parameter to -Djute.maxbuffer=4194304. Then, restart ResourceManager.
Check whether the data that is written by the ZooKeeper server exceeds the upper limit of the ZooKeeper server buffer.
Problem description: The ZooKeeper logs contain the following exception information: Exception causing close of session 0x1000004d5701b6a: Len error ***.
Solution: Add the -Djute.maxbuffer= parameter or update the configuration of the -Djute.maxbuffer= parameter for each node of the ZooKeeper service. You can configure this parameter to increase the upper limit of the buffer. Unit: bytes.
Check whether the ZooKeeper node that is marked with the ephemeral flag and that is elected the leader by ResourceManagers is occupied by other sessions and is not released. Perform this check if no exception information is contained in the ResourceManager or ZooKeeper logs. You can run the stat command on the ZooKeeper node that is marked with the ephemeral flag in ZooKeeper-cli to check whether the ZooKeeper node is occupied by other sessions and is not released. ${yarn.resourcemanager.zk-state-store.parent-path}/${yarn.resourcemanager.cluster-id}/ActiveStandbyElectorLock is the configuration path of the ZooKeeper node. The issue may be caused by unknown issues of the default leader election method or by an issue in ZooKeeper.
We recommend that you modify the leader election method. On the yarn-site tab, you can add a parameter whose name is yarn.resourcemanager.ha.curator-leader-elector.enabled and set the parameter to true. If the parameter is already configured, make sure that the parameter value is true. Then, restart the ResourceManager.
Resolving ResourceManager OOM errors
ResourceManager can encounter several types of out-of-memory (OOM) errors. To resolve an OOM error, first identify its type in the ResourceManager logs. The following sections describe common OOM errors, their causes, and solutions.
-
Java heap space, GC overhead limit exceeded, or frequent full garbage collection (full GC)
-
Cause
-
Insufficient JVM heap memory causes this error. The ResourceManager process cannot allocate enough memory for new objects. Even after running full GC cycles, the process cannot reclaim enough heap memory and throws the OOM error.
-
The ResourceManager maintains many resident objects that the JVM cannot reclaim, including metadata for clusters, queues, applications, containers, and nodes. The heap memory consumed by these objects grows with cluster size, so larger clusters require more memory. In addition, ResourceManager retains historical application information, which consumes more memory over time. Even on a single-node cluster, allocate at least 2 GB of heap memory.
-
-
Solution
-
If the master node has sufficient resources, increase the ResourceManager heap memory by modifying the
YARN_RESOURCEMANAGER_HEAPSIZEparameter in theyarn-env.shfile. -
For small-scale clusters, consider reducing the number of historical applications to store by modifying the
yarn.resourcemanager.max-completed-applicationsparameter in theyarn-site.xmlfile. The default value is 10,000.
-
-
-
unable to create new native thread
-
This error occurs when the total number of threads on the ResourceManager node reaches the system limit, preventing new thread creation.
The thread limit is determined by the maximum number of user processes and the maximum number of process IDs (PIDs). You can view the user process limit by running the
ulimit -a | grep "max user processes"command and the PID limit by running thecat /proc/sys/kernel/pid_maxcommand. -
Solution
-
If the number of available threads is configured too low, increase the relevant system configuration values. For nodes with smaller specifications, this typically means tens of thousands of threads. For nodes with larger specifications, it may be hundreds of thousands.
-
If the thread limit is configured correctly, a specific process on the node is likely consuming too many threads. You can then identify which processes are using the most threads.
Run the command
ps -eLf | awk '{print $2}' | uniq -c | awk '{print $2"\t"$1}' | sort -nrk2 | headto view the top 10 processes consuming the most threads. The output is in the format: [Process ID] [Thread Count].
-
-
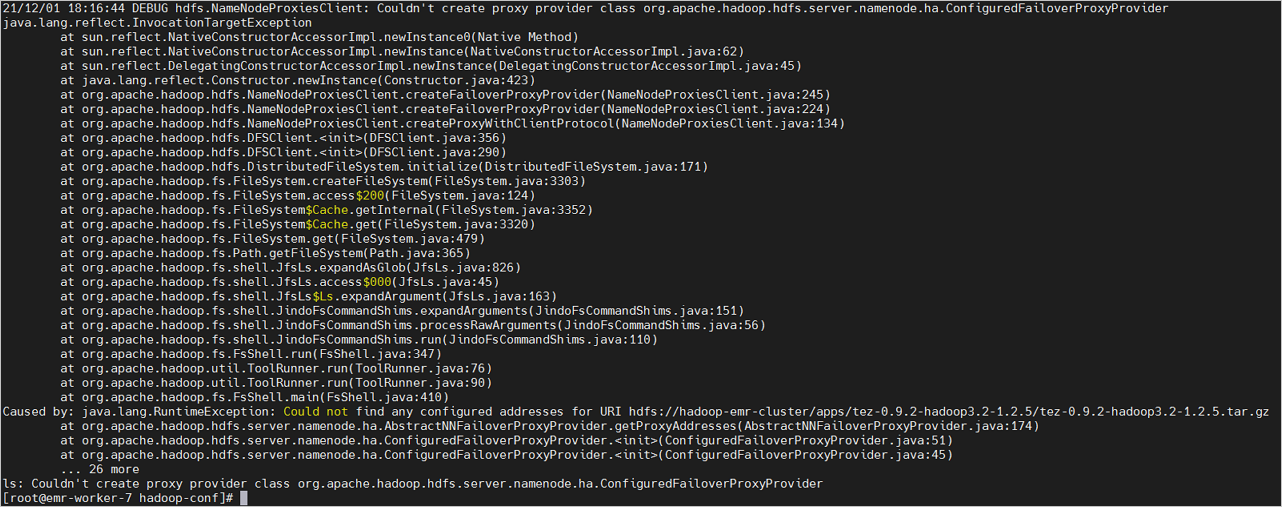
Why does localization fail when a node starts to run a job, and why are job logs unable to be collected or deleted?
Problem description: The NodeManager logs contain the following exception information: java.io.IOException: Couldn't create proxy provider class org.apache.hadoop.hdfs.server.namenode.ha.ConfiguredFailoverProxyProvider.
Cause: The HDFS configurations are incorrect.
Solution:
The exception information is encapsulated and is not the root cause of the issue. To identify the root cause, you must check the debug-level logs.
In the CLI for a Hadoop client, you can run a command such as
hadoop fs -ls /to access Hadoop. Then, run the following command to enable debugging:export HADOOP_LOGLEVEL=DEBUGIn a runtime environment with the Log4j configuration, add
log4j.logger.org.apache.hadoop.hdfs.server.namenode.ha.ConfiguredFailoverProxyProvider=DEBUGto the end of the Log4j configuration.
The example in the following figure shows that the root cause of the issue is that a user modified the configurations of NameServices. The user changed emr-cluster to hadoop-emr-cluster. However, the new node used the original configurations of NameServices after a scale-out.
On the Configure tab of the HDFS service page of a cluster in the EMR console, check whether the parameters are correctly configured.
How do I handle a resource localization exception?
Problem description:
The AM container that is used to process jobs fails to start, and the following error message is reported:
Application application_1412960082388_788293 failed 2 times due to AM Container for appattempt_1412960082388_788293_000002 exited with exitCode: -1000 due to: EPERM: Operation not permitted. The exception information is the diagnostic information about the failed job.An error is reported when an application resource package is decompressed after it is downloaded for resource localization. You can check the following NodeManager logs:
INFO org.apache.hadoop.yarn.server.nodemanager.containermanager.localizer.ResourceLocalizationService: Failed to download rsrc { { hdfs://hadoopnnvip.cm6:9000/user/heyuan.lhy/apv/small_apv_20141128.tar.gz, 1417144849604, ARCHIVE, null },pending,[(container_1412960082388_788293_01_000001)],14170282104675332,DOWNLOADING}
EPERM: Operation not permitted
        at org.apache.hadoop.io.nativeio.NativeIO$POSIX.chmodImpl(Native Method)
        at org.apache.hadoop.io.nativeio.NativeIO$POSIX.chmod(NativeIO.java:226)
        at org.apache.hadoop.fs.RawLocalFileSystem.setPermission(RawLocalFileSystem.java:629)
        at org.apache.hadoop.fs.DelegateToFileSystem.setPermission(DelegateToFileSystem.java:186)
        at org.apache.hadoop.fs.FilterFs.setPermission(FilterFs.java:235)
        at org.apache.hadoop.fs.FileContext$10.next(FileContext.java:949)
        at org.apache.hadoop.fs.FileContext$10.next(FileContext.java:945)
        at org.apache.hadoop.fs.FSLinkResolver.resolve(FSLinkResolver.java:90)
        at org.apache.hadoop.fs.FileContext.setPermission(FileContext.java:945)
        at org.apache.hadoop.yarn.util.FSDownload.changePermissions(FSDownload.java:398)
        at org.apache.hadoop.yarn.util.FSDownload.changePermissions(FSDownload.java:412)
        at org.apache.hadoop.yarn.util.FSDownload.changePermissions(FSDownload.java:412)
        at org.apache.hadoop.yarn.util.FSDownload.call(FSDownload.java:352)
        at org.apache.hadoop.yarn.util.FSDownload.call(FSDownload.java:57)
        at java.util.concurrent.FutureTask.run(FutureTask.java:262)
        at java.util.concurrent.Executors$RunnableAdapter.call(Executors.java:471)
        at java.util.concurrent.FutureTask.run(FutureTask.java:262)
        at java.util.concurrent.ThreadPoolExecutor.runWorker(ThreadPoolExecutor.java:1145)
        at java.util.concurrent.ThreadPoolExecutor$Worker.run(ThreadPoolExecutor.java:615)
        at java.lang.Thread.run(Thread.java:744)
Cause: The application resource package contains soft links, which result in the resource localization exception.
Solution: Delete the soft links that are contained in the application resource package.
What do I do if the error message "No space left on device" is displayed and a container fails to start or run?
Possible causes and solutions:
Check whether no space is available on the disk.
Check the CGroups configuration for cgroup.clone_children in the /sys/fs/cgroup/cpu/hadoop-yarn/ and /sys/fs/cgroup/cpu/ directories.
If the value of cgroup.clone_children is 0, change the value to 1. Run the
echo 1 > /sys/fs/cgroup/cpu/cgroup.clone_childrencommand for startup items.If the issue persists, check the cpuset.mems or cpuset.cpus file at a directory of the same level. The value of cgroup.clone_children in the hadoop-yarn directory must be the same as the value of cgroup.clone_children at the upper-level directory.
Check whether the number of subdirectories of the CGroups directory exceeds the upper limit, which is 65,535. To view the number of subdirectories, find the configuration file for YARN and check the configuration of the yarn.nodemanager.linux-container-executor.cgroups.delete-delay-ms or yarn.nodemanager.linux-container-executor.cgroups.delete-timeout-ms parameter.
Domain names fail to be resolved in NodeManager or during the running of jobs. What do I do?
Problem description: The following error message is displayed: java.net.UnknownHostException: Invalid host name: local host is: (unknown).
Possible causes and solutions:
Check whether the Domain Name System (DNS) server is correctly configured.
Run the following command to check the configuration of the DNS server:
cat /etc/resolv.confCheck whether the required rules are configured for Port 53 of the firewall.
If the required rules are configured, disable the firewall.
Check whether the Name Service Cache Daemon (NSCD) service is enabled for the DNS server.
Run the following command to check the status of the NSCD service:
systemctl status nscdIf the NSCD service is enabled for the DNS server, run the following command to disable the NSCD service:
systemctl stop nscd
Handling NodeManager OOM errors
NodeManager can encounter several out-of-memory (OOM) errors. To resolve an OOM error, first identify the error type in the NodeManager logs. The following sections describe common OOM error types, their causes, and solutions.
-
Java heap space,GC overhead limit exceeded, or frequent full GCs-
Cause
-
Direct cause: Insufficient JVM heap memory. The NodeManager process cannot obtain enough resources for its internal objects. This error is thrown when the garbage collector, despite running full GC cycles, cannot free enough heap memory to allocate new objects.
-
Cause analysis: The NodeManager process has few resident objects, typically including only basic information about the current node, running applications, and executing containers. These objects do not consume much space. However, the cache and buffer of the external shuffle service can consume significant heap memory. This usage is affected by shuffle service-related configurations (such as
spark.shuffle.service.index.cache.sizeorspark.shuffle.file.bufferfor Spark, andmapreduce.shuffle.ssl.file.buffer.sizeormapreduce.shuffle.transfer.buffer.sizefor MapReduce) and is proportional to the number of running applications or containers using the external shuffle service. On high-specification nodes that run many tasks, configure the NodeManager process with larger memory. A minimum of 1 GB is recommended.
-
-
Solution
-
If the node has sufficient resources, increase the NodeManager heap memory by modifying the
YARN_NODEMANAGER_HEAPSIZEparameter in theyarn-env.shfile. -
Verify the external shuffle service configuration. For example, ensure the Spark cache configuration does not consume most of the heap memory.
-
-
-
Direct buffer memory-
Cause
-
Direct cause: An off-heap memory overflow, typically related to the external shuffle service. For example, shuffle service RPCs consume off-heap memory when they use NIO
DirectByteBuffer. -
Cause analysis: Off-heap memory usage is proportional to the number of applications or containers that use the shuffle service. On nodes that run many tasks using the shuffle service, ensure the configured off-heap memory for the NodeManager process is sufficient.
-
-
Solution
Check the
-XX:MaxDirectMemorySizeoff-heap memory configuration (in theYARN_NODEMANAGER_OPTSparameter in theyarn-env.shfile). If this parameter is not set, the off-heap memory size defaults to the heap memory size. If the current size is insufficient, increase the value.
-
-
unable to create new native threadFor details, see the "unable to create new native thread" section in How do I handle ResourceManager OOM errors?.
NodeManager startup failure: Missing cgroup directory
-
Error message: ResourceHandlerException: Unexpected: Cannot create yarn cgroup Subsystem:cpu Mount point:/proc/mounts User:hadoop Path:/sys/fs/cgroup/cpu/hadoop-yarn
-
Cause: An unexpected ECS instance restart, often caused by a kernel defect (a known issue in version 4.19.91-21.2.al7.x86_64), destroys the CPU cgroup's in-memory data and invalidates the cgroup.
-
Solution: Modify the bootstrap script for existing and scale-out node groups to create the cgroup directory and configure the
rc.localfile to automatically recreate this directory on each instance startup.# enable cgroups mkdir -p /sys/fs/cgroup/cpu/hadoop-yarn chown -R hadoop:hadoop /sys/fs/cgroup/cpu/hadoop-yarn # enable cgroups after reboot echo "mkdir -p /sys/fs/cgroup/cpu/hadoop-yarn" >> /etc/rc.d/rc.local echo "chown -R hadoop:hadoop /sys/fs/cgroup/cpu/hadoop-yarn" >> /etc/rc.d/rc.local chmod +x /etc/rc.d/rc.local
Ineffective NodeManager resource configuration
-
Description: After modifying the yarn.nodemanager.resource.cpu-vcores and yarn.nodemanager.resource.memory-mb parameters, saving the configuration, and restarting NodeManager, the resource counts do not update.
-
Cause: These parameters must be applied at the node group level because instances in a node group can have different CPU and memory specifications.
-
Solution: In the E-MapReduce (EMR) console, apply the resource settings to the NodeManager's node group. For more information, see Manage configuration items. On the Configure tab of the YARN service, switch the filter to Node Group Configuration. Select the target node group, such as emr-core (CORE), and modify the parameters on the yarn-site.xml sub-tab.
Troubleshoot unhealthy nodes
-
Causes
-
The disk health checker marks a node as unhealthy if the ratio of healthy directories to total directories falls below the threshold defined by the
yarn.nodemanager.disk-health-checker.min-healthy-disksparameter inyarn-site.xml(default: 0.25). For example, on a NodeManager node with four disks, the node becomes unhealthy only if the directories on all four disks are unhealthy. Otherwise, the NodeManager status report only reports thatlocal-dirs are badorlog-dirs are bad. For more information, see What to do if the "local-dirs are bad" or "log-dirs are bad" message is reported?. -
Issue reported by the NodeManager health check script: This check is disabled by default. You can enable this check by setting the
yarn.nodemanager.health-checker.script.pathparameter inyarn-site.xmlto the path of a health check script.
-
-
Solutions
-
For disk issues, see What to do if the "local-dirs are bad" or "log-dirs are bad" message is reported?.
-
For issues reported by the health check script, troubleshoot the problem based on your custom script.
-
Node disk issues: 'local-dirs are bad' or 'log-dirs are bad'
-
Cause: The disk health checker periodically verifies that
local-dirs(the cache directory for task dependencies, intermediate data, and other files) andlog-dirs(the directory for task execution logs) meet several conditions. If a directory fails any condition, the system marks it as bad.-
Readable
-
Writable
-
Executable
-
Disk usage is below the configured threshold. This is controlled by the
yarn.nodemanager.disk-health-checker.max-disk-utilization-per-disk-percentageparameter in theyarn-site.xmlfile, which defaults to 90%.Available disk space is greater than the minimum free space requirement. This is controlled by the
yarn.nodemanager.disk-health-checker.min-free-space-per-disk-mbparameter in theyarn-site.xmlfile, which defaults to 0.
-
-
Solution
-
Insufficient disk space typically causes this issue. If any of the following scenarios apply, consider scaling out the disks:
-
The NodeManager node is high-spec and runs many tasks.
-
The disk capacity is relatively small.
-
Tasks depend on large data or files.
-
Tasks generate a large amount of intermediate data.
-
Task logs are large and consume significant disk space.
-
-
Check the
yarn.nodemanager.localizer.cache.target-size-mbparameter in theyarn-site.xmlfile. If this value is too high relative to the disk capacity, the cache for historical tasks can consume excessive disk space. The system automatically clears this cache only after it exceeds the configured size. -
If a damaged disk causes the issue, see Replace a damaged local disk in the cluster.
-
What do I do if the error message "User [dr.who] is not authorized to view the logs for application ***" is displayed?
Problem description: Information in the following figure is displayed when the log page is opened.

Cause: The access control list (ACL) rules are checked when you access the NodeManager Log page. If ACL rules are enabled and a remote user wants to view the logs of an application, the remote user must meet one of the following conditions:
The remote user is the admin user.
The remote user is the owner of the application.
The remote user meets the ACL rules that are customized for the application.
Solution: Check whether the remote user meets one of the preceding conditions.
What do I do if the error message "HTTP ERROR 401 Authentication required" or "HTTP ERROR 403 Unauthenticated users are not authorized to access this page" is displayed?
Problem description: The error HTTP ERROR 401 or HTTP ERROR 403 is reported when you access a web UI or call a RESTful API. The details of HTTP ERROR 401 is shown in the following figure.
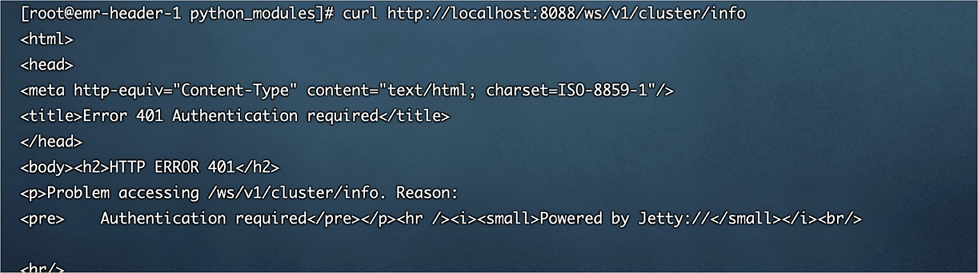
Cause: YARN uses the simple authentication method and does not allow anonymous access. For more information, see Authentication for Hadoop HTTP web-consoles in the official documentation of Apache Hadoop.
Solutions:
Method 1: Configure a URL parameter to specify a remote user, such as user.name=***.
Method 2: In the Configuration Filter section on the Configure tab of the HDFS service page of a cluster in the EMR console, search for the hadoop.http.authentication.simple.anonymous.allowed parameter and change the value of the parameter to true to allow anonymous access. For more information about the parameter, see Authentication for Hadoop HTTP web-consoles in the official documentation of Apache Hadoop. Then, restart the HDFS service. For more information, see Restart a service.
Why is the display value of TotalVcore incorrect?
In the cluster or metrics RESTful API section in the upper-right corner of the web UI of YARN, the display value of TotalVcore is incorrect. This is a computing logic issue for TotalVcore in Apache Hadoop versions earlier than 2.9.2. For more information, see Total #VCores in cluster metrics is wrong when CapacityScheduler reserved some containers in the official documentation of Apache Hadoop.
The issue is fixed in EMR V3.37.x, EMR V5.3.x, and their later minor versions.
What do I do if the information about an application that is displayed on the web UI of TEZ is incomplete?
Open the Developer tools of a browser and troubleshoot the issue.
If you identify the issue when you access an address in the http://<rmAddress>/ws/v1/cluster/apps/APPID format, a possible cause is that the application is cleared by ResourceManager. ResourceManager in YARN reserves information about a maximum of 1,000 applications by default. Applications that exceed the maximum number are cleared based on the sequence that the applications are started.
If you identify the issue when you access an address in the http://<tsAddress>/ws/v1/applicationhistory/... format, and the error code 500 which indicates that the application is not found is returned, a possible cause is that the information about the application fails to be stored or the application information is cleared by the Timeline store. You can check the configuration of the yarn.resourcemanager.system-metrics-publisher.enabled parameter to determine whether the application information fails to be stored. You can check the time to live (TTL) of LevelDB to determine whether the application information is cleared by the Timeline store.
If you identify the issue when you access an address in the http://<tsAddress>/ws/v1/timeline/... format, and the code 200 is returned but NotFound is displayed in the code. Perform the following operation:
View the information that is printed when the AM syslog service starts. You can check the following normal initialization information:
 [INFO] [main] |history.HistoryEventHandler|: Initializing HistoryEventHandler withrecoveryEnabled=true, historyServiceClassName=org.apache.tez.dag.history.logging.ats.ATSHistoryLoggingService
 [INFO] [main] |ats.ATSHistoryLoggingService|: Initializing ATSHistoryLoggingService with maxEventsPerBatch=5, maxPollingTime(ms)=10, waitTimeForShutdown(ms)=-1, TimelineACLManagerClass=org.apache.tez.dag.history.ats.acls.ATSHistoryACLPolicyManager
If the following exception occurs, the configuration of the yarn.timeline-service.enabled parameter is incorrect for AM that is running. A possible cause is that an issue occurs in FlowAgent. A Hive job can be implemented in FlowAgent by running a Hive command or a Beeline command. By default, the value of the yarn.timeline-service.enabled parameter is set to false in FlowAgent.
[WARN] [main] |ats.ATSHistoryLoggingService|: org.apache.tez.dag.history.logging.ats.ATSHistoryLoggingService is disabled due to Timeline Service being disabled, yarn.timeline-service.enabled set to false
Spark Thrift Server task on the YARN web UI
If you select Spark when creating a cluster, the cluster automatically starts a default Spark Thrift Server service. This service uses one YARN driver's resources. By default, Spark Thrift Server tasks request resources from YARN through this driver.
OSS URL support for yarn.timeline-service.leveldb-timeline-store.path
The yarn.timeline-service.leveldb-timeline-store.path parameter does not support OSS bucket URLs.
When you create a Hadoop cluster, the yarn.timeline-service.leveldb-timeline-store.path parameter defaults to the value of the hadoop.tmp.dir parameter. Do not modify the hadoop.tmp.dir parameter for HDFS, as this affects the yarn.timeline-service.leveldb-timeline-store.path parameter.
Timeline Server connection timeouts or high resource usage
When running a large number of Tez jobs, you may experience connection timeouts when writing events to the YARN Timeline Server. This occurs because the Timeline Server process consumes excessive CPU resources, causing the node's CPU usage to reach its limit. This affects job execution and non-core services such as report generation. To resolve this issue, modify the following configuration items.
In the EMR console, modify the configurations for the Tez and YARN services. For instructions, see Manage configuration items.
-
On the tez-site.xml tab of the Configure page for the Tez service, add the tez.yarn.ats.event.flush.timeout.millis parameter and set its value to 60000. This parameter sets the timeout for Tez tasks writing events to the YARN Timeline Server.
-
On the yarn-site.xml tab of the Configure page for the YARN service, add or modify the following configuration items. Then, on the Status page of the YARN service, restart TimelineServer.
Parameter
Value
Description
yarn.timeline-service.store-class
org.apache.hadoop.yarn.server.timeline.RollingLevelDBTimelineStore
The event storage class for the YARN Timeline Server.
yarn.timeline-service.rolling-period
daily
The event rolling period for the YARN Timeline Server.
yarn.timeline-service.leveldb-timeline-store.read-cache-size
4194304
The read cache size for the YARN Timeline Server LevelDB store.
yarn.timeline-service.leveldb-timeline-store.write-buffer-size
4194304
The write buffer size for the YARN Timeline Server LevelDB store.
yarn.timeline-service.leveldb-timeline-store.max-open-files
500
The maximum number of open files for the YARN Timeline Server LevelDB store.