The Node Visualization area on the Elasticsearch console provides a visual overview of cluster health, per-node metrics (CPU, memory, disk, and JVM usage), and node configurations, so you can quickly identify issues without running API calls.
Prerequisites
Before you begin, ensure that you have:
-
An Alibaba Cloud Elasticsearch instance
-
Access to the Alibaba Cloud Elasticsearch console
Go to the Node Visualization area
Log on to the Alibaba Cloud Elasticsearch console.
In the left navigation menu, choose Elasticsearch Clusters.
Navigate to the target cluster.
In the top navigation bar, select the resource group to which the cluster belongs and the region where the cluster resides.
On the Elasticsearch Clusters page, find the cluster and click its ID.
-
On the Elasticsearch Clusters page, find the cluster and click its ID.
-
On the Basic Information page, scroll to the Node Visualization area at the bottom.
View cluster health status
Console
-
Go to the Node Visualization area.
-
Hover over the Cluster icon to view the cluster Status.

The cluster health status uses the following color codes:
Color Status Meaning Green Normal All primary shards and replicas are allocated. The cluster is fully operational. Yellow Alert All primary shards are allocated, but some replicas are not. Fault tolerance is reduced. Red Warning At least one primary shard is unallocated. Some data may be unavailable. Gray Unknown Node information has not been retrieved for an extended period. For a diagnostic report, use Artificial Intelligence for IT Operations (AIOps).
NoteCluster and node status retrieval may be delayed. During an instance change, the displayed status may not reflect real-time conditions.
API
Check cluster health with the Health API:
GET /_cluster/healthFor parameters and usage details, see View the health status of an Elasticsearch cluster.
View node health status
-
Go to the Node Visualization area.
-
Check the color of each node to determine its health status.
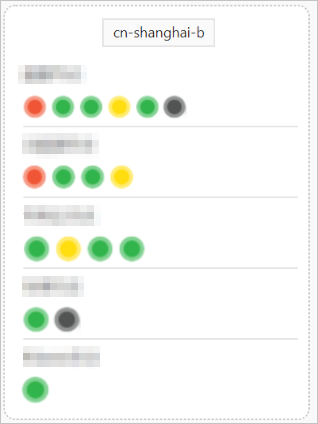
Node colors follow the same scheme as cluster health (green, yellow, red, gray) and correspond to the threshold-based metrics in CloudMonitor. For details, see Metric description and suggestions for handling exceptions.
-
Hover over a node to view its details:
Metric Description Node Name Name identifier of the node Node Status Current health status CPU Utilization | CPU Specifications CPU utilization and specifications (for example, 1.7% | 2Cores) Memory Size Total memory allocated to the node (for example, 4G) Disk Usage | Total Storage Space Disk utilization and total storage (for example, 2.0% | 20GiB) JVM Memory JVM memory utilization percentage 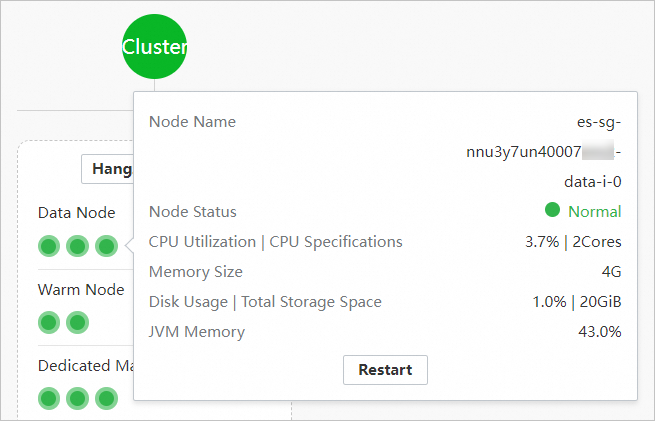 Note
Note-
If the Node Status is red, yellow, or gray, a diagnostic message appears, such as Node Is Disconnected. We Recommend That You Use AIOps For Diagnosis. or Node Is In Poor Health. We Recommend That You Use AIOps For Diagnosis. Click AIOps Diagnosis to go to and run a diagnostic.
-
Click Restart. In the Restart dialog box, you can restart the cluster or node.
-
View node configuration
-
Go to the Node Visualization area.
-
Click the
 icon in the upper-right corner to open the configuration list.
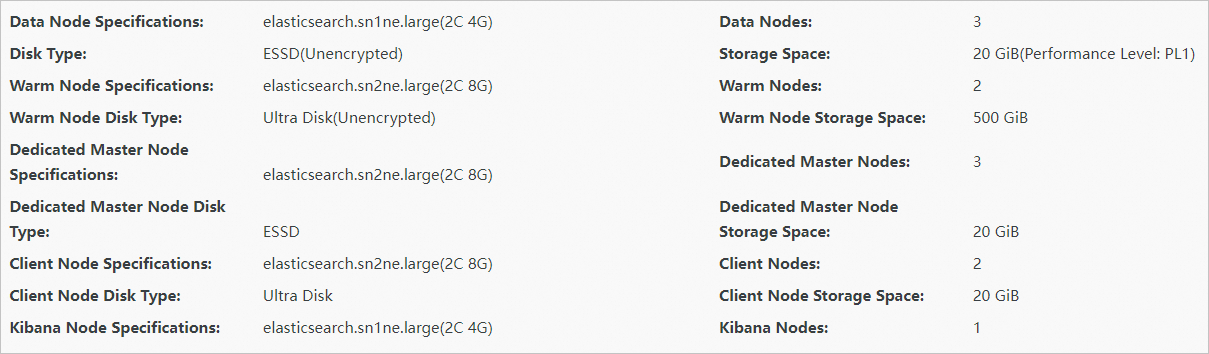
The list displays specifications and configurations for each node. For parameter descriptions, see ES instance node configurations.
References
-
ListAllNode: retrieve node information programmatically