This topic describes how to view the monitoring data of cloud disks attached to Elastic Compute Service (ECS) instances to effectively monitor system performance and stability.
Background information
Disk performance is measured by using the following metrics:
IOPS: measures the number of read and write operations that an Elastic Block Storage (EBS) device can process per second. High IOPS is essential for transaction-intensive applications.
Throughput: measures the amount of data transferred per second. Unit: MB/s. High throughput is essential for applications that require a large number of sequential read and write operations.
Latency: measures the amount of time that is required for an EBS device to process an I/O request. Unit: seconds, milliseconds, or microseconds. High latency may cause performance to degrade or lead to errors in applications that require low latency.
Disk usage: measures the percentage of used disk capacity to the total disk capacity. It is an important metric for measuring disk resource utilization. High disk usage may cause performance degradation or errors in applications.
Inode usage: measures the percentage of used inodes to the total number of inodes. Inodes are data structures used in Linux file systems to manage file metadata such as filenames and timestamps. If inodes are used up, you cannot create new files even if disk space is available.
Burst I/Os: measures the number of burst I/Os. If the performance burst feature is enabled (by default) and performance bursts on Enterprise SSD (ESSD) AutoPL disks, burst performance fees incur and are related to the total number of burst I/Os per hour. For information about billing, see Performance burst fee cap rules.
For information about the performance of different cloud disk categories, see Block storage performance.
View the IOPS, throughput, and latency metrics of a cloud disk
Minute-level monitoring
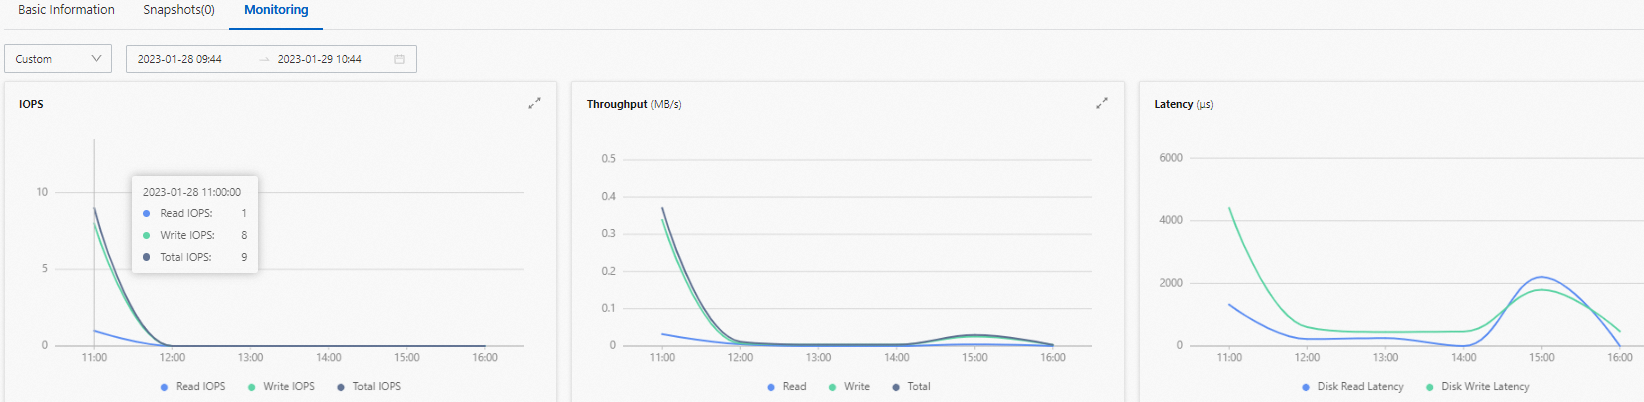
You can view the minute-level monitoring data of a cloud disk, such as IOPS, throughput, and latency, in the ECS console.
Go to ECS console - Block Storage.
In the top navigation bar, select the region and resource group of the resource that you want to manage.

Find the cloud disk whose monitoring data you want to view and click the disk ID to go to the Basic Information tab of the disk details page.
Click the Monitoring tab.
In the time range section, click the
 icon and specify the start time and end time of the time range for query.
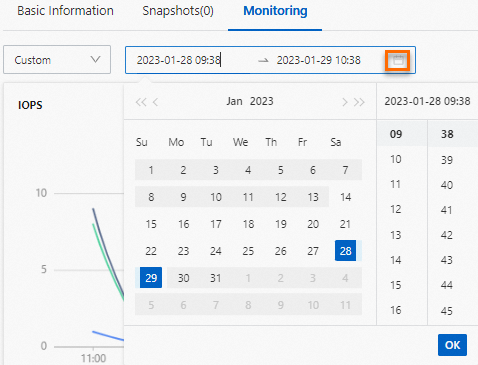
Move the pointer over a point in time in the charts to view the metrics.
Near real-time monitoring
Compared with the ECS console, which displays the minute-level monitoring data of each cloud disk, CloudLens for EBS collects near-real-time monitoring data of cloud disks. You can monitor the finer-grained performance changes of cloud disks by using Cloud Disk Analysis in the EBS console.
The first time you use CloudLens for EBS, activate CloudLens for EBS as prompted.
Log on to the Elastic Block Storage (EBS) console.
NoteThe first time you log on to the EBS console, you must create a service-linked role for EBS as prompted. For more information, see Service-linked role for EBS.
In the left-side navigation pane, choose .
In the upper-left corner of the top navigation bar, select a region.
On the Cloud Disk Analysis page, find the disk whose monitoring data you want to view and click Monitor in the Actions column.
On the Near Real-time Monitoring page, you can view the monitoring data of the target disk within the specified time range.
NoteSecond-level monitoring data has a latency of 1 to 5 minutes. When you query data, the data from the last 1 to 5 minutes may be zero, which indicates that the data values have not yet been retrieved.
Metric descriptions
Data Metric
Description
Throughput
The amount of data successfully transferred by the disk within the query time range. The unit is MBps. Follow this metric if you deploy applications that require many sequential read and write operations.
For an ESSD AutoPL disk, second-level monitoring displays the baseline and pre-provisioned throughput metrics. For more information about ESSD AutoPL disks, see ESSD AutoPL disks.
IOPS
The number of input/output operations per second (IOPS) processed by the disk. This metric indicates the ability of the block storage to handle read and write operations. Follow this metric if you deploy transaction-intensive applications.
For an ESSD AutoPL disk, second-level monitoring displays the baseline and pre-provisioned IOPS metrics. For more information about ESSD AutoPL disks, see ESSD AutoPL disks.
Average I/O size (read/write)
The amount of data read or written by the disk per I/O operation. The unit is bytes. I/O size affects the throughput and efficiency of the storage system. Some systems may be optimized for transferring large blocks of data, while others may perform better with small block operations. Understanding and optimizing the I/O size based on your application can improve overall system performance.
BPS watermark
The ratio of the current disk throughput to the maximum disk throughput. When this ratio approaches 100%, the disk is transferring data at near its maximum capacity. A further increase in load may cause performance bottlenecks and affect application response speed. Monitoring this ratio helps you adjust the disk configuration or optimize your application to avoid potential performance issues.
IOPS watermark
The ratio of the current disk IOPS to the maximum disk IOPS. When this ratio approaches 100%, the disk is close to its limit for handling concurrent requests. This can lead to increased latency or failed requests. Monitoring this ratio helps you determine if the disk meets the real-time performance needs of your application. You can then make adjustments to maintain efficient and stable application performance.
Metric value descriptions
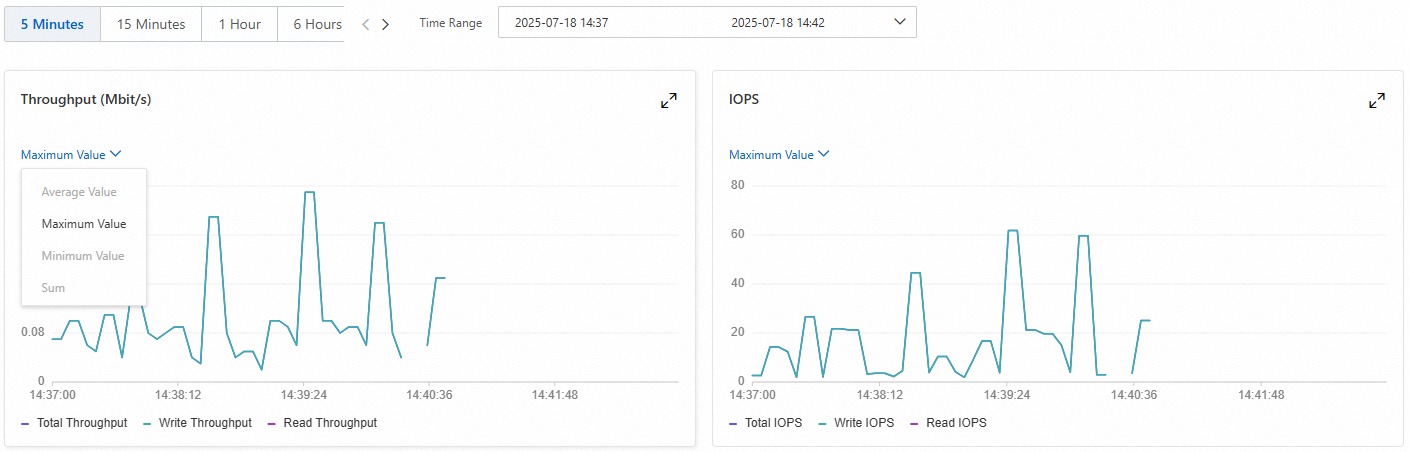
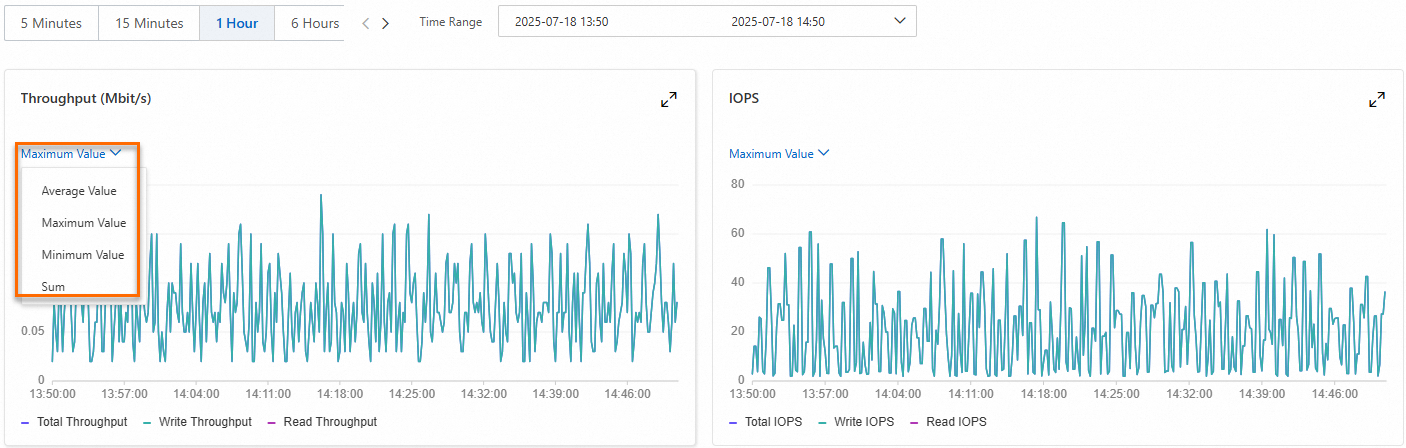
Second-level monitoring lets you query monitoring data from the last 5 minutes, 15 minutes, 1 hour, 6 hours, or 1 day. Each metric value is the maximum value of the monitoring data collected for the disk within a 5-second interval.
Time range: 5 minutes or 15 minutes
You can query only the maximum value of the disk monitoring data. The minimum granularity displayed in the data metric window is 5 seconds.
Time range: 1 hour, 6 hours, or 1 day
You can query the maximum, minimum, average, and total values of the disk monitoring data. The minimum granularity displayed in the data metric window depends on the time range. For example, if you query monitoring data from the last hour, the minimum granularity displayed is 10 seconds.
Maximum value: The maximum value recorded during the 10-second interval.
Minimum value: The minimum value recorded during the 10-second interval.
Average value: The average value recorded during the 10-second interval.
Total: The sum of all values recorded during the 10-second interval.
View the disk usage, read/write bytes, read/write requests, and inode usage metrics of a cloud disk
Make sure that you have installed the CloudMonitor agent on your ECS instance.
Go to ECS console - Instances.
In the top navigation bar, select the region and resource group of the resource that you want to manage.
Go to the details page of the instance to which the destination cloud disk is attached.
Choose .
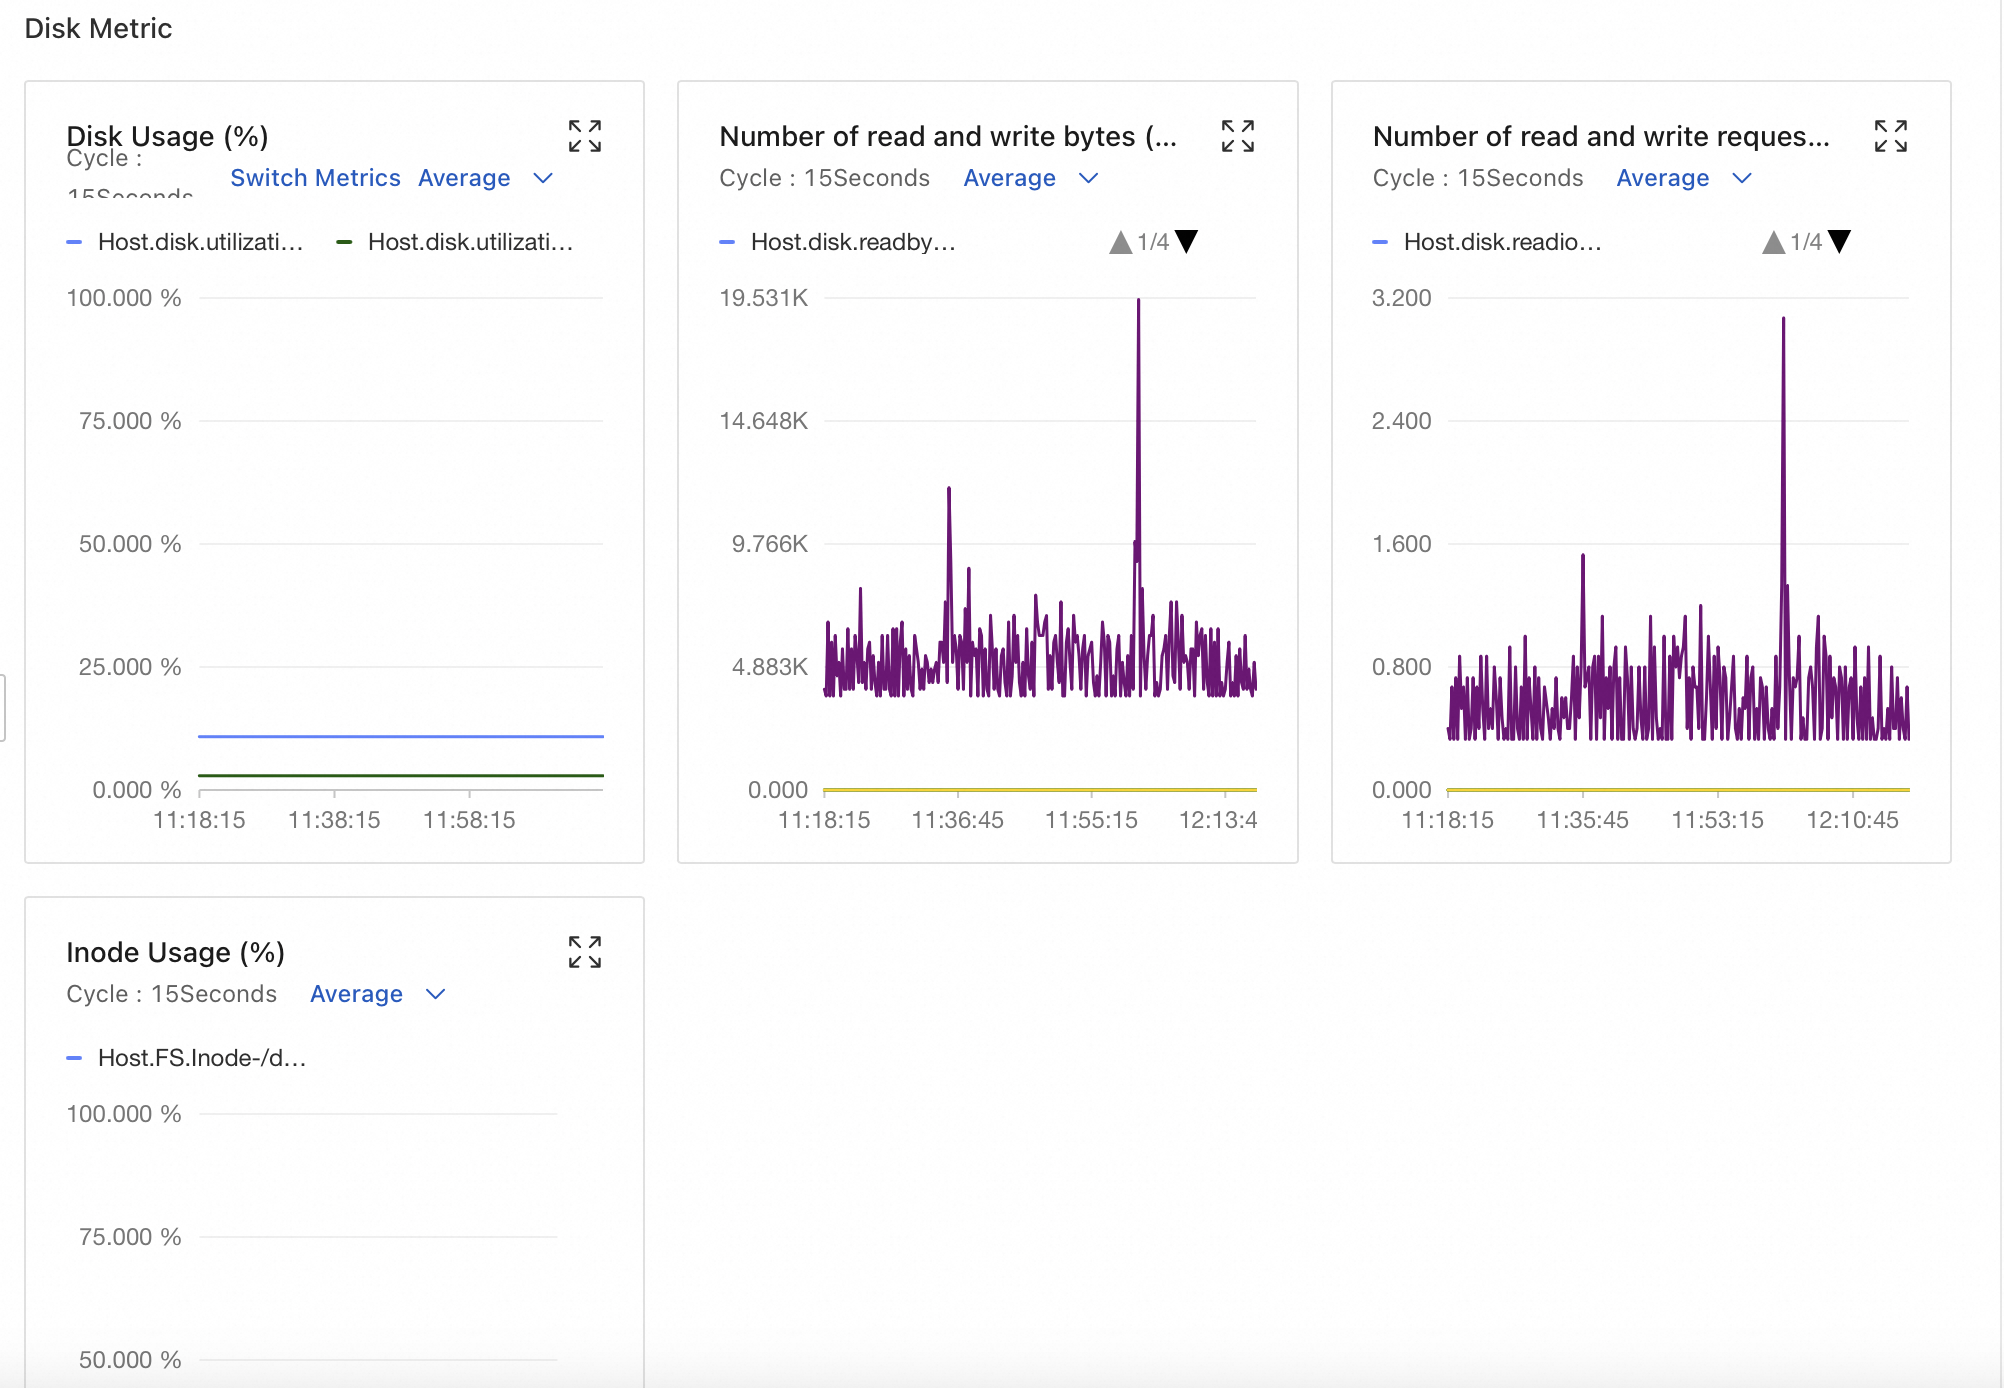
View the metrics in the Disk Metric section.
NoteOperating system metrics are collected once every 15 seconds. For more information, see Operating system monitoring.
(Optional) Configure alert rules for the cloud disk. For more information, see Monitoring hosts.
NoteYou can configure alert rules based on your business scenarios. If the values of disk metrics meet alert conditions, alerts are triggered and CloudMonitor sends alert notifications to help you identify and handle exceptions at the earliest opportunity.
View the number of burst I/Os of an ESSD AutoPL disk
EBS console
The first time you use CloudLens for EBS, activate CloudLens for EBS as prompted.
Log on to the Elastic Block Storage (EBS) console.
NoteThe first time you log on to the EBS console, you must create a service-linked role for EBS as prompted. For more information, see Service-linked role for EBS.
In the left-side navigation pane, choose .
In the upper-left corner of the top navigation bar, select a region.
On the Cloud Disk Analysis page, find the ESSD AutoPL disk that you want to view and click Monitor in the Actions column.
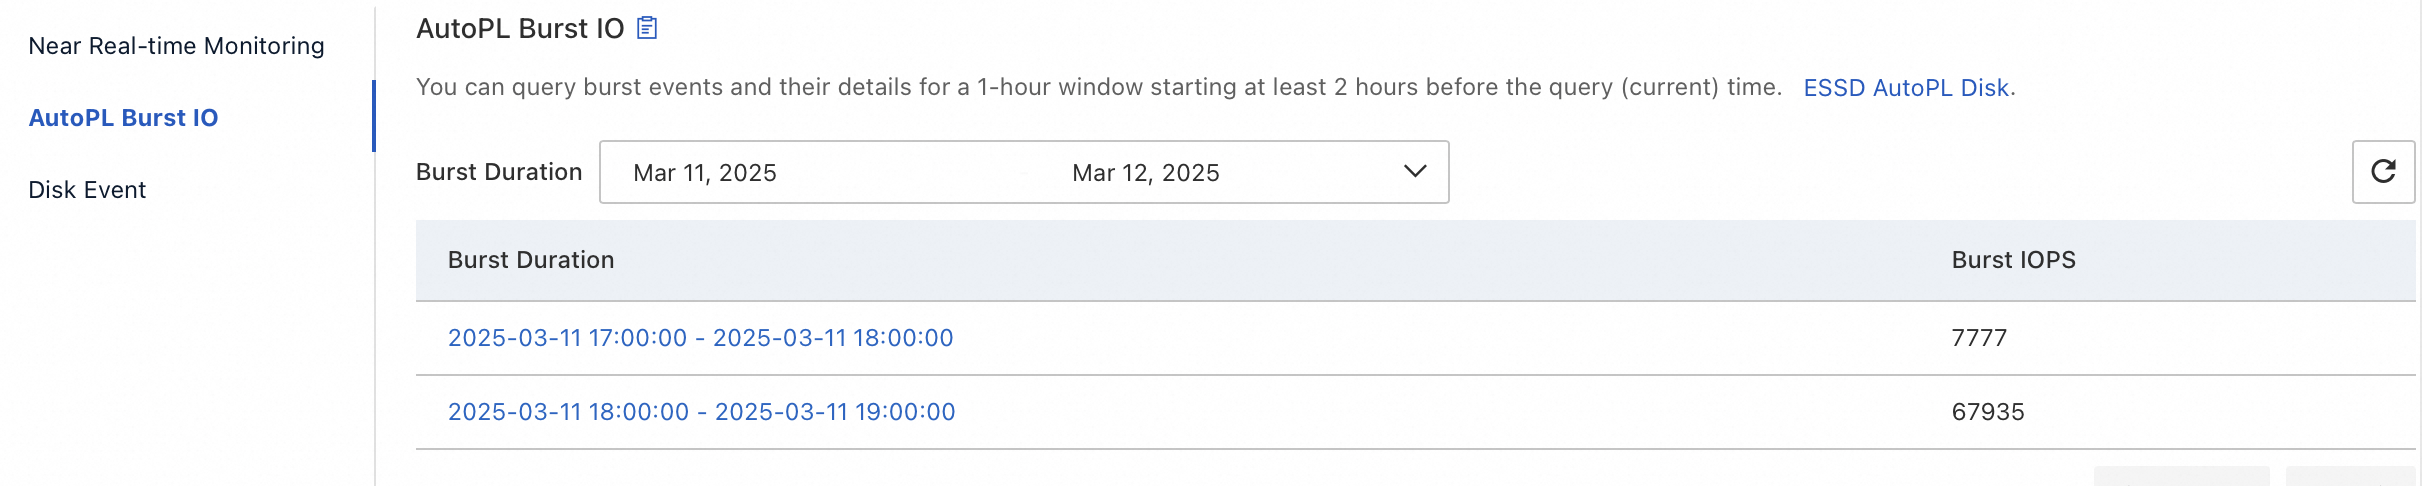
In the navigation pane on the left, click the AutoPL Burst IO tab.
On the AutoPL Burst IO page, you can view the burst details of the ESSD AutoPL disk, such as the burst time and burst count.
NoteThe latency for burst event queries and burst detail queries is less than 1 hour. This means that the latest available data is from one hour ago.
ECS console
You can view the number of burst I/Os of an ESSD AutoPL disk within a specific time range in the ECS console.
Go to ECS console - Block Storage.
In the top navigation bar, select the region and resource group of the resource that you want to manage.
Find the cloud disk whose monitoring data you want to view and click the disk ID to go to the Basic Information tab of the disk details page.
Click the Monitoring tab.
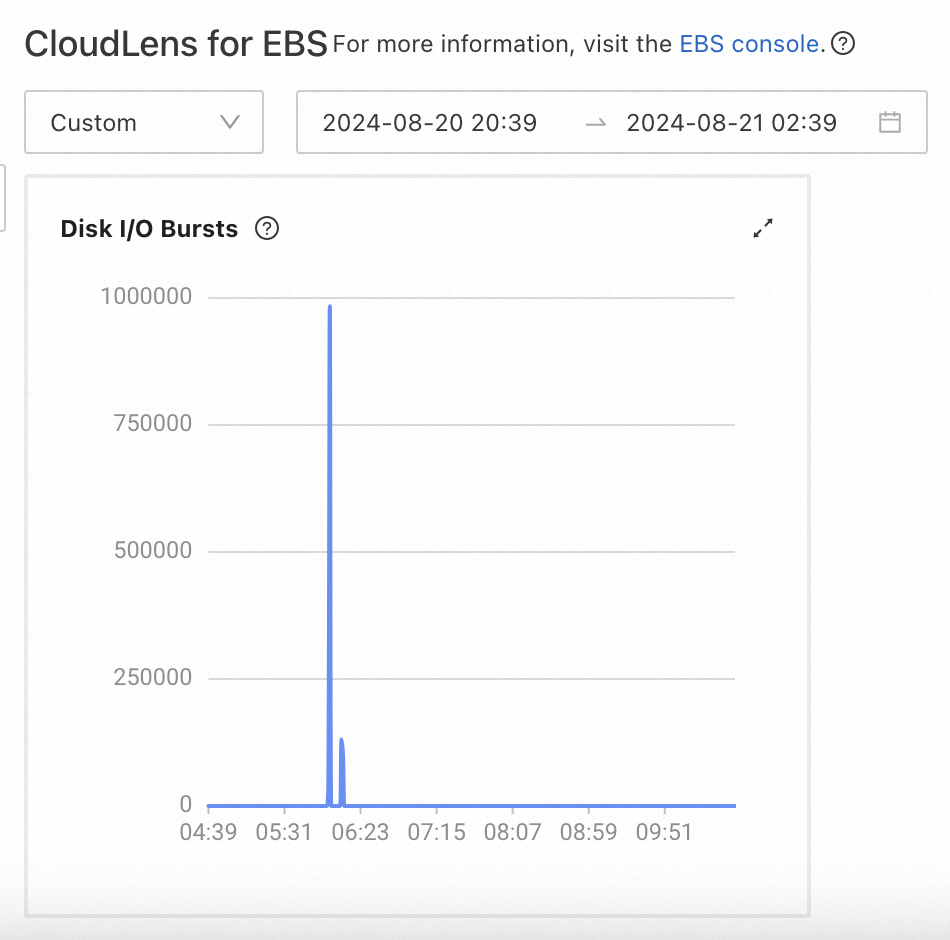
In the CloudLens for EBS section, click the
icon and specify the start time and end time of the time range for query.NoteThe query time range cannot exceed 6 hours.
You can move the pointer over a point in time in the chart to view the number of burst I/Os.