Monitor disk performance, events, and ESSD AutoPL burst details in real time with EBS Lens.
Enable CloudLens for EBS
Enable CloudLens for EBS when you first log on to the EBS console.
Log on to the EBS console.
NoteWhen you log on to the EBS console for the first time, follow the on-screen instructions to create an EBS service-linked role. For more information, see EBS service-linked role.
In the left navigation bar, select .
-
On the CloudLens for EBS page, click Activate Now to enable CloudLens for EBS.
View second-level disk monitoring data
Log on to the EBS console.
NoteWhen you log on to the EBS console for the first time, follow the on-screen instructions to create an EBS service-linked role. For more information, see EBS service-linked role.
In the left navigation bar, select .
In the top navigation bar, select a region.
-
On the Cloud Disk Analysis page, find the target disk and click Monitoring in the Actions column.
-
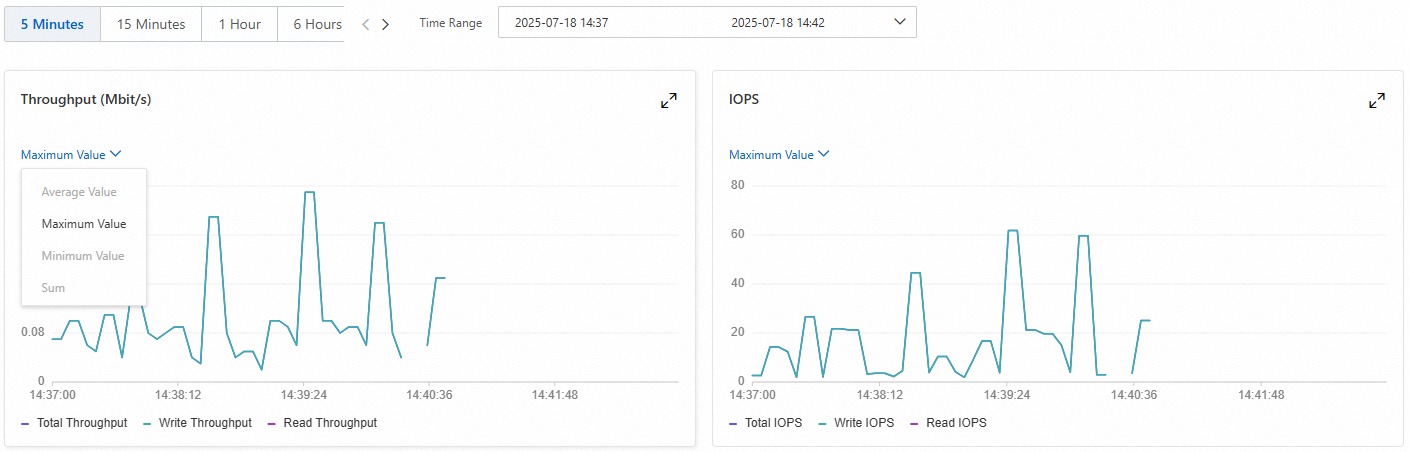
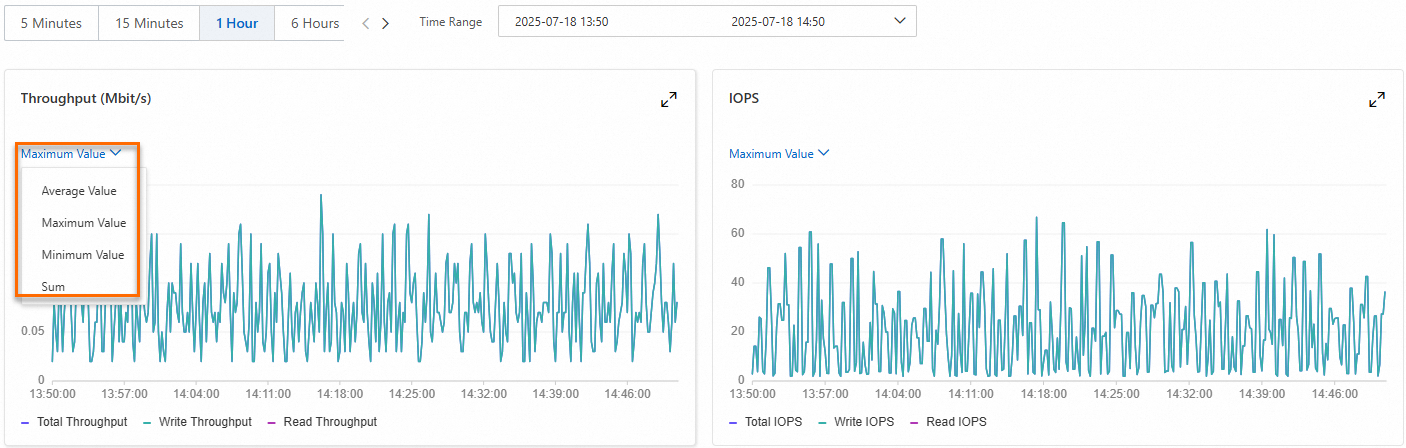
On the Near Real-time Monitoring page, view the disk monitoring data within the specified time range.
NoteSecond-level monitoring data has a latency of 1 to 5 minutes. Data from the last 1 to 5 minutes may show as zero because the values have not been retrieved yet.
Metric descriptions
Data Metric
Description
Throughput
The data transferred by the disk per second, in MBps. Monitor this metric for applications with heavy sequential read/write operations.
For ESSD AutoPL disks, second-level monitoring also displays baseline and pre-provisioned throughput. See ESSD AutoPL disks.
IOPS
The number of I/O operations per second (IOPS) processed by the disk. Monitor this metric for transaction-intensive applications.
For ESSD AutoPL disks, second-level monitoring also displays baseline and pre-provisioned IOPS. See ESSD AutoPL disks.
Average I/O size (read/write)
The data read or written per I/O operation, in bytes. Optimizing I/O size for your application workload can improve overall storage performance.
BPS watermark
The ratio of current throughput to maximum throughput. When this ratio approaches 100%, the disk is near its transfer capacity limit. A further load increase may cause performance bottlenecks.
IOPS watermark
The ratio of current IOPS to maximum IOPS. When this ratio approaches 100%, the disk is near its concurrent request limit, which can increase latency or cause request failures.
Metric value descriptions
Second-level monitoring supports query ranges of 5 minutes, 15 minutes, 1 hour, 6 hours, or 1 day. Each metric value is the maximum within a 5-second interval.
-
Time range: 5 minutes or 15 minutes
Only the maximum value is available. The minimum display granularity is 5 seconds.
-
Time range: 1 hour, 6 hours, or 1 day
Maximum, minimum, average, and total values are available. The display granularity depends on the time range. For example, a 1-hour query uses a 10-second granularity.
-
Maximum value: The peak value in the 10-second interval.
-
Minimum value: The lowest value in the 10-second interval.
-
Average value: The mean value in the 10-second interval.
-
Total: The sum of all values in the 10-second interval.
-
-
View performance burst details for an ESSD AutoPL disk
Monitor burst time and burst count for ESSD AutoPL disks with performance burst enabled. See ESSD AutoPL disks.
Log on to the EBS console.
NoteWhen you log on to the EBS console for the first time, follow the on-screen instructions to create an EBS service-linked role. For more information, see EBS service-linked role.
In the left navigation bar, select .
In the top navigation bar, select a region.
-
On the Cloud Disk Analysis page, find the target ESSD AutoPL disk and click Monitoring in the Actions column.
-
In the navigation pane on the left, click the AutoPL Burst IO tab.
-
On the AutoPL Burst IO page, view the burst details, such as burst time and burst count.
NoteBurst event and burst detail queries have a latency of up to 1 hour. The latest available data is from one hour ago.
View risk events for a single disk
Risk events alert you to disks that require action to maintain stable operation and data security.
Log on to the EBS console.
NoteWhen you log on to the EBS console for the first time, follow the on-screen instructions to create an EBS service-linked role. For more information, see EBS service-linked role.
In the left navigation bar, select .
In the top navigation bar, select a region.
-
On the Cloud Disk Analysis page, find the target disk and click Event in the Actions column.
-
On the Cloud Disk Events page, view the event notifications and take action based on the suggestions.
See Disk events and Disk event descriptions.