This topic describes how to query and analyze JSON website logs and provides sample SQL statements.
Prerequisites
Text logs in JSON mode are collected for subsequent log query and analysis. For more information, see Collect text logs in JSON mode.
Step 1: Create indexes
Log on to the Simple Log Service console.
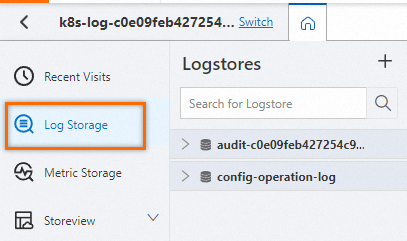
In the Projects section, click the project that you want to manage.

On the tab, click the logstore that you want to manage.
In the upper-right corner of the query and analysis page, choose . If no indexes are created, click Enable on the page. For more information about full-text indexes and field indexes and how to create an index, see Create indexes.
NoteIf you want to query all fields in logs, we recommend that you use full-text indexes. If you want to query only specific fields, we recommend that you use field indexes. This helps reduce index traffic. If you want to analyze fields, you must create field indexes. You must include a SELECT statement in your query statement for analysis.
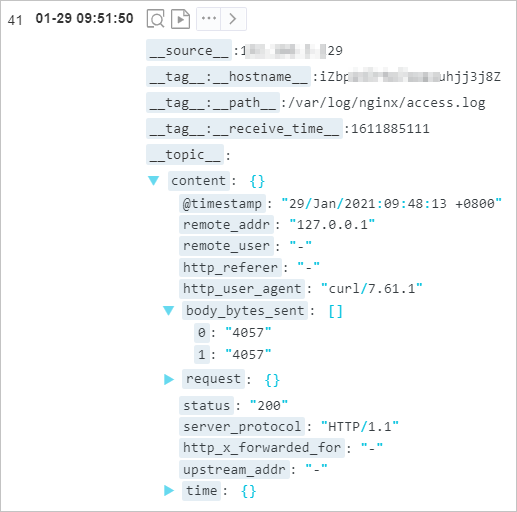
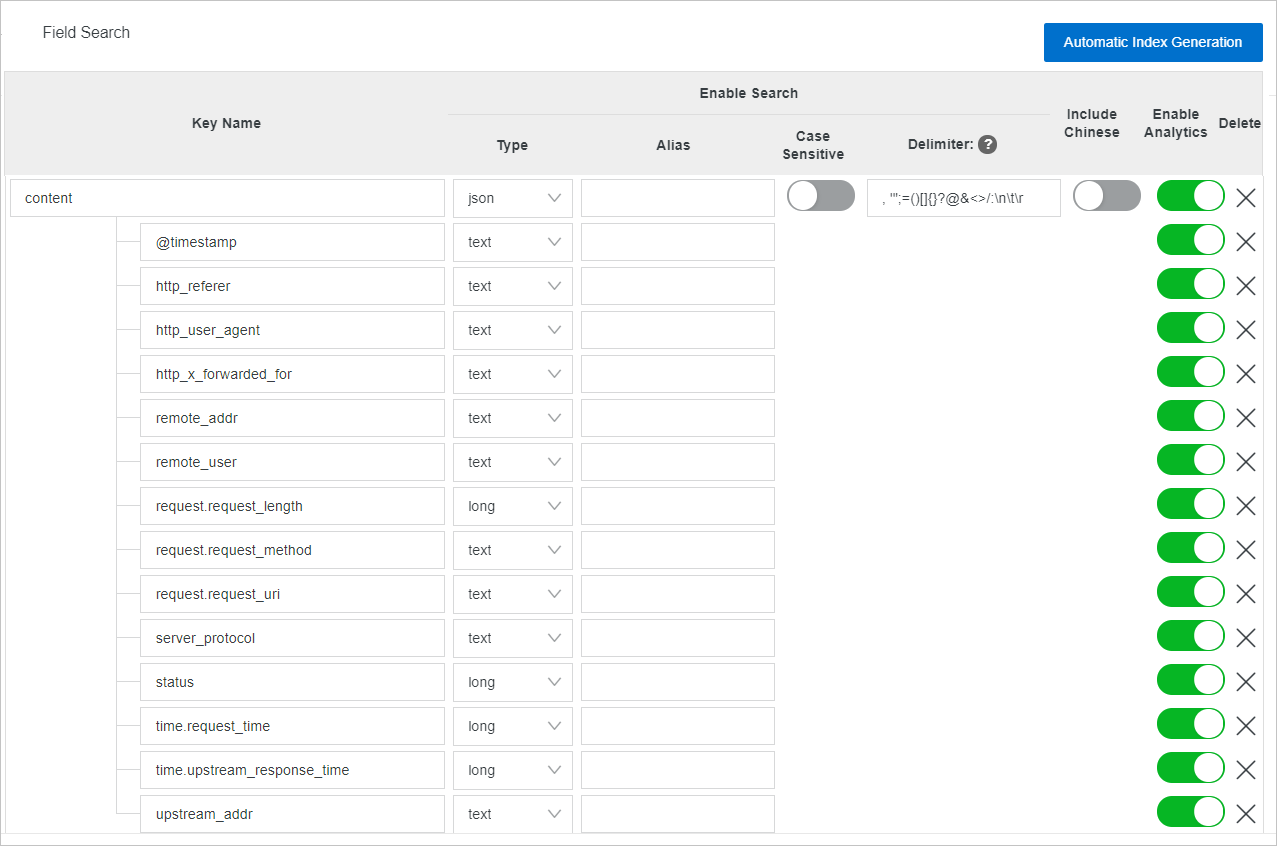
Create field indexes. The following figures show a sample JSON log and an example on how to create indexes for fields.
The
__topic__,__source__, and__tag__fields are reserved fields of Simple Log Service. For more information, see Reserved fields.The
@timestamp,remote_addr,remote_user,http_referer,http_user_agent,status,server_protocal,http_x_forward_for, andupstream_addrfields exclude leaf nodes. You can create an index for thecontentfield.The
requestandtimefields include leaf nodes, and the leaf nodes are not JSON arrays.You cannot create indexes for the
requestortimefield. You cannot query or analyze the two fields.You can create indexes for the leaf nodes of the
requestandtimefields. When you create the indexes, you must specify the complete names of the leaf nodes. Format:KEY1.KEY2.KEY3. Examples:time.request_timeandtime.upstream_response_time. After the indexes are created, you can query thetime.request_timeandtime.upstream_response_timefields.
The value of the
body_bytes_sentfield is a JSON array. You cannot create indexes for the field or the leaf nodes of the field You cannot query or analyze thebody_bytes_sentfield or the leaf nodes of thebody_bytes_sentfield.
Step 2: Reindex data
The new indexes take effect only on data that is collected after the indexes are created. If you want to query historical data, you must use the reindexing feature. For more information, see Reindex logs for a Logstore.
Step 3: Query and analyze logs
On the query and analysis page of the Logstore, enter a query statement, specify a query time range, and then execute the statement. When you write an analytic statement, you must use double quotation marks (") to enclose field names and single quotation marks (') to enclose strings. You must include a SELECT statement in the analytic statement. For more information about how to query and analyze logs, see Query and analyze logs. For more information about common questions on how to query and analyze JSON logs, see FAQ about the query and analysis of JSON logs.
Query the logs of requests for which status code 200 is returned.
content.status:200Query the logs of requests whose length is greater than 70.
content.request.request_length > 70Query the logs of GET requests.
content.request.request_method:GETCalculate the number of logs of requests by status code.
* | SELECT "content.status", COUNT(*) AS PV GROUP BY "content.status"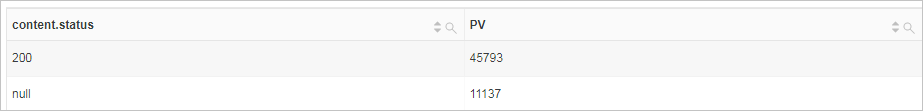
Calculate the number of requests by request duration and sort the results in ascending order of request duration.
* | SELECT "content.time.request_time", COUNT(*) AS count GROUP BY "content.time.request_time" ORDER BY "content.time.request_time"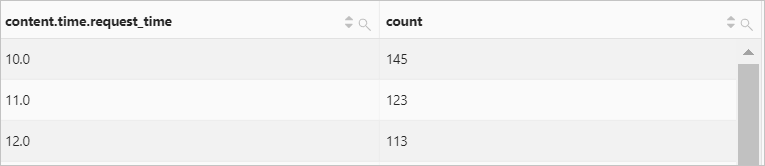
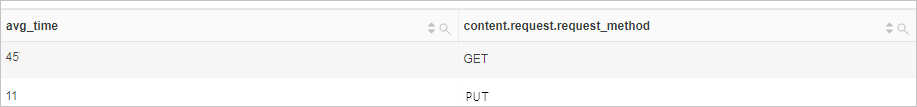
Calculate the average request duration by request method.
* | SELECT avg("content.time.request_time") AS avg_time,"content.request.request_method" GROUP BY "content.request.request_method"