This guide explains how to enable X-Pack for your Alibaba Cloud Logstash cluster. By associating your Logstash cluster with an Elasticsearch cluster, you can monitor Logstash performance and health directly from the Elasticsearch Kibana console.
Prerequisites
An Alibaba Cloud Elasticsearch cluster is created.
Ensure the Elasticsearch cluster reside in the same virtual private cloud (VPC) as the Logstash cluster. Also, make sure the Elasticsearch and Logstash clusters use identical major versions or these versions are compatible.
Your Elasticsearch cluster is properly configured:
Public network access to Kibana is enabled. For more information, see Connect to a cluster using Kibana.
Auto Indexing is enabled for the Elasticsearch cluster (See Configure the YML file), or the +.monitoring-logstash* or +.monitoring* indexes are manually added (See Index API).
Usage notes
Logstash cluster restart: Enabling or disabling X-Pack will restart the Logstash cluster. will cause your Logstash cluster to restart. This may briefly affect your services. Plan this operation during a maintenance window or off-peak hours.
Monitoring data visibility: Logstash monitoring data will only become visible in the Kibana console after the Logstash cluster successfully restarts following the configuration change.
Procedure
Go to the Logstash Clusters page of the Alibaba Cloud Elasticsearch console.
Navigate to the target cluster.
In the top navigation bar, select the region where the cluster resides.
On the Logstash Clusters page, find the cluster and click its ID.
In the left navigation pane, click Cluster Monitoring.
In the Monitoring and Alerting Configuration section, locate X-Pack Monitoring and click Modify.
In the Modify Configuration panel, configure the feature:
Set X-Pack Monitoring to Enable.
For Elasticsearch Cluster, select your Elasticsearch cluster from the dropdown.
For Username and Password, enter your credentials to access Elasticsearch.
Click Test Connectivity.
Confirm that no errors are reported, indicating a successful connection.
Click OK to apply the settings.
You will return to the Cluster Monitoring page and the Logstash cluster restarts.
Verify monitoring data in Kibana
Allow the Logstash cluster to complete its restart. The X-Pack Monitoring status should then show as Enable with the associated Elasticsearch cluster details.
Access Kibana console:
In the left navigation menu of your Elasticsearch cluster's details page, choose Data Visualization.
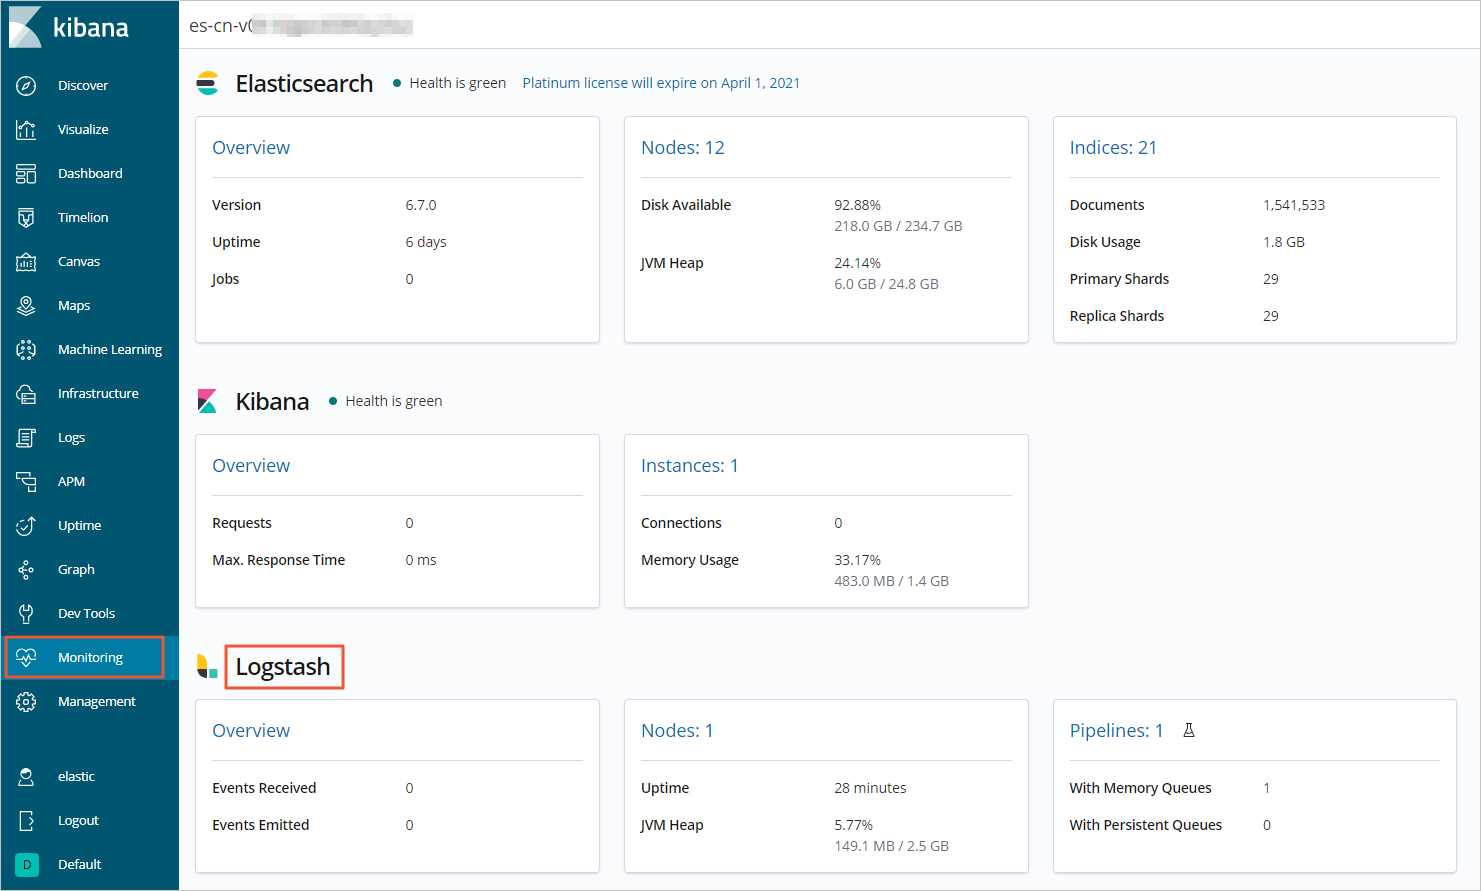
Once in Kibana, navigate to the Monitoring section.
NoteKibana console operations may vary slightly depending on your Elasticsearch version.
Under the Logstash section, you should now see the monitoring data for your Logstash cluster.