You can view the resource usage of a dedicated host and configure alert rules in the CloudMonitor console. This allows you to monitor the status of a dedicated host and take early measures if necessary.
Background information
CloudMonitor collects metrics of Alibaba Cloud resources and custom metrics, and allows you to configure alerts on specific metrics. This way, you can monitor the usage of your Alibaba Cloud resources and the status of your Alibaba Cloud services. You can also resolve alerts at the earliest opportunity to ensure the availability of your applications. For more information, see What is CloudMonitor?
View the resource usage of a dedicated host
You can view the status of each resource running on a dedicated host and the data of each metric in the CloudMonitor console.
Log on to the ECS console.
In the left-side navigation pane, choose Instances & Images >
 > Dedicated Hosts.
 In the top navigation bar, select the region and resource group to which the resource belongs.

On the Host tab of the Dedicated Hosts page, find the desired host and click the
 icon to go to the CloudMonitor console.
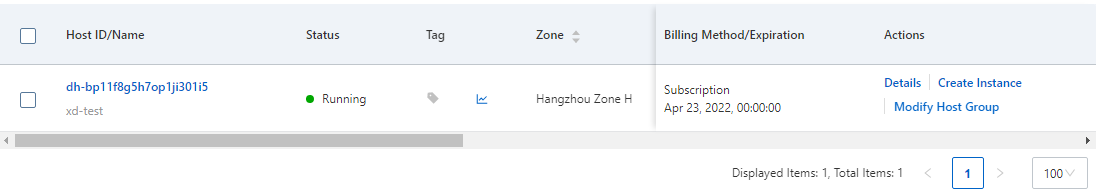
View the resource usage of the dedicated host.
You can view the monitoring data of the last 30 days. CloudMonitor monitors the computing, networking, and storage resources of a dedicated host. The following table describes the metrics. For more information, see Dedicated host metrics.
Resource
Metric
Unit
Description
Computing
UserCpuUtilization
%
The average CPU usage of all the ECS instances on a dedicated host
Network
UserNetworkRxPPS
pps
The sum of inbound packets of all the ECS instances on a dedicated host per second
UserNetworkTxPPS
pps
The sum of outbound packets of all the ECS instances on a dedicated host per second
UserNetworkRxBandwidth
bit/s
The total inbound bandwidth of all the ECS instances on a dedicated host per second
UserNetworkTxBandwidth
bit/s
The total outbound bandwidth of all the ECS instances on a dedicated host per second
Storage
The read capacity of virtual machines running on a dedicated host
IOPS
The total number of requests that read data from the disks of all the ECS instances on a dedicated host
UserDiskWriteIOPS
IOPS
The total number of requests that write data to the disks of all the ECS instances on a dedicated host
UserDiskReadBPS
Byte/s
The total number of bytes that are read from the disks of all the ECS instances on a dedicated host
UserDiskWriteBPS
Byte/s
The total number of bytes that are written to the disks of all the ECS instances on a dedicated host
Create an alert rule for a dedicated host
You can also configure alert rules to monitor resources. If an alert is triggered based on the alert rules, CloudMonitor sends an alert notification to you. This way, you are notified of the status of your resources at the earliest opportunity.
Create an alert contact or alert group. For more information, see Create an alert contact or alert contact group.
Move the pointer over the metric for which you want to create an alert rule. Then click
 .
. In the Configure Rule Description panel, configure an alert rule and click OK.
The following table describes the parameters of an alert rule.
Parameter
Description
Example
Alert Rule
The alert rule monitors the average CPU usage of all the ECS instances on the dedicated host.
ddhxxx-cpu
Metric Type
Select a metric type as needed.
Single Metric: Select a metric and set the threshold and alert level for the metric.
Multiple Metrics: Select an alert level and specify alert conditions for two or more metrics.
Dynamic Threshold: For more information about dynamic thresholds, see Overview and Create dynamic threshold-triggered alert rules.
Single Metric
Metric
Select a metric from the drop-down list.
UserCpuUtilization
Threshold and Alert Level
Set the alert level and threshold as needed.
Critical
Value >= 80%
In the Create Alert Rule panel, set the parameters according to the following table.
Parameter
Description
Example
Associated Resources
By default, the dedicated host whose resource usage you are viewing is associated with the alert rule. You can also associate other dedicated hosts at the same time.
To associate another dedicated host with the alert rule, click the drop-down arrow next to Associated Resources, select a region from the Region drop-down list, and then select the desired dedicated host from the drop-down list. You can select multiple dedicated hosts.
Keep the default settings.
Mute For
If the alert conditions are still met 30 minutes after the first alert, another alert notification is sent.
Keep the default settings.
Effective Period
Specify whether to trigger alerts only between 19:00 and 20:59.
Keep the default settings.
Alert Contact Group
Select an alert contact group from the drop-down list.
test
For more information, see Create an alert rule.
Click Confirm.
References
To learn how to view the monitoring data of other services, see Cloud service monitoring.
After you create an alert rule, you can modify, disable, enable, or delete the alert rule. For more information, see Manage alert rules.