The Business Monitoring page displays the protection data of the Anti-DDoS Origin instance to help you understand the security posture of your service. The protection data includes the traffic trends of protected assets and the DDoS attack events. This topic describes the monitoring data and how to query service monitoring data.
Prerequisites
An Anti-DDoS Origin instance is purchased, and your assets are protected by the instance.
For more information, see Purchase an Anti-DDoS Origin instance and Add an object for protection.
Background information
On the Business Monitoring page, you can query data generated on and after June 3, 2021. If you want to query data generated before June 3, 2021, perform operations described in Manage instances.
Query service monitoring data
Log on to the Traffic Security console.
In the left-side navigation pane, choose .
In the top navigation bar, select the resource group to which the instance belongs and the region in which the instance resides.
Anti-DDoS Origin 1.0 (Subscription) instance: Select the region in which the instance resides.
Anti-DDoS Origin 2.0 (Subscription) instance and Anti-DDoS Origin 2.0 (Pay-as-you-go): Select All Regions.
In the upper-left corner of the page that appears, select the Anti-DDoS Origin instance that you want to query.
View the service monitoring data of the Anti-DDoS Origin instance.
The following table describes the data that you can view on the Business Monitoring page.
Section
Purpose
Supported operation
Description
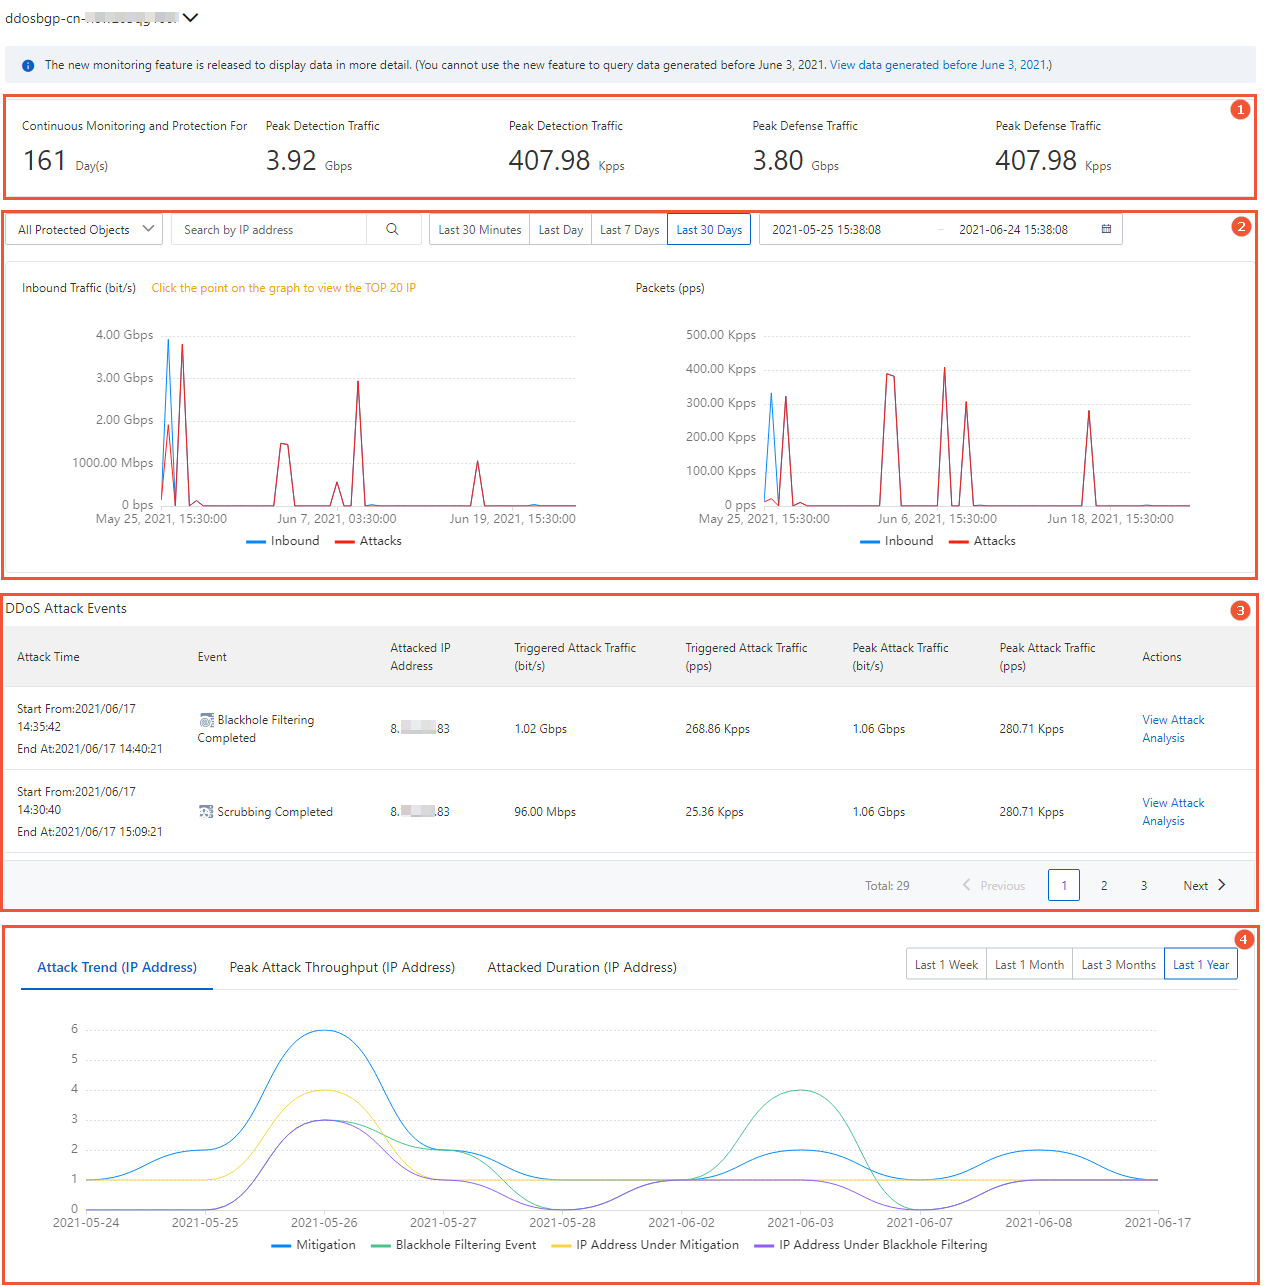
Service statistics (Section 1)
The statistics help you understand the historical peak traffic of attacks that are detected by the Anti-DDoS Origin instance. The statistics include Continuous Monitoring and Protection For, Detection Traffic Peak in bit/s, Detection Traffic Peak in pps, Mitigation Traffic Peak in bit/s, and Mitigation Traffic Peak in pps.
None.
Traffic trend charts (Section 2)
The charts help you understand the trends of inbound traffic destined for the public IP addresses that are protected by the Anti-DDoS Origin instance. The charts include the Inbound Traffic (bit/s) and Packets (pps) charts.
You can specify a protected object and a time range to query related data.
DDoS attack events (Section 3)
The event list and charts allow you to view details about attack events detected by the Anti-DDoS Origin instance. The events include traffic scrubbing and blackhole filtering events. You can analyze and handle attack events based on the details.
You can specify a protected object and a time range to query related data.
You can view attack analysis results, manually cancel traffic scrubbing, and download packet capture files for a specific DDoS attack event.
Attack trend charts (Section 4)
The charts help you understand the trends of network attacks detected by the Anti-DDoS Origin instance over the last year. This helps you evaluate potential risks to your service and what is required to protect your service.
You can specify a time range to query related data.
Description of service statistics
This section displays the following data:
Continuous Monitoring and Protection For: indicates the number of days that the Anti-DDoS Origin instance protects your assets.
Detection Traffic Peak: indicates the peak traffic of your service that is detected by the Anti-DDoS Origin instance. The peak traffic is measured by both bandwidth in bit/s and packet forwarding rate in pps.
Mitigation Traffic Peak: indicates the peak traffic of attacks that are detected by the Anti-DDoS Origin instance. The peak traffic is measured by both bandwidth in bit/s and packet forwarding rate in pps.
Description of traffic trend charts
This section provides the following charts:
Inbound Traffic (bit/s): shows the trends of inbound and outbound traffic for protected IP addresses. Unit: bit/s. This chart shows the total traffic and attack traffic.
Packets (pps): shows the trends of packet forwarding rates in the inbound and outbound direction for protected IP addresses. Unit: pps. This chart shows the forwarding rates of all packets and attack packets.
In this section, you can configure the following items to query related data:
Protected object: You can select All Protected Objects from the drop-down list or enter an IP address that is protected in the search box to query related data.
If you select All Protected Objects, you can click a point on a trend chart to query the top 20 IP addresses that are protected in descending order by traffic volume at that point in time.
Time range: You can select Last 30 Minutes, Last Day, Last 7 Days, or Last 30 Days. You can also specify a custom time range to query related data.
A custom time range must be within the last 30 days.
Description of DDoS attack events
List of attack events: shows all the attack events that are detected by the Anti-DDoS Origin instance. Each attack event record contains the following information: Attack Time, Event, Attacked IP Address, Triggered Attack Traffic (bit/s), Triggered Attack Traffic (pps), Peak Attack Traffic (bit/s), and Peak Attack Traffic (pps).
You can perform the following operations on an attack event:
Cancel Scrubbing: You can perform this operation only on in-progress traffic scrubbing events. If you confirm that a traffic surge is not caused by attacks, you can manually cancel traffic scrubbing. For example, a traffic surge may be caused by promotional events.
Download: You can perform this operation to download the packet capture files for the attack event. You can use the downloaded files as evidence to report to network supervisors.
View Attack Analysis: You can perform this operation to view analysis details about the attack event. For more information, see View information on the Attack Analysis page.
You can specify a protected object and a time range in the traffic trend charts section to filter attack events.
Description of attack trend charts
Section 4 displays the trends of network attacks detected by the Anti-DDoS Origin instance over the last year. This section provides the following charts:
Attack Trend: displays the trends of the number of attacks detected by the Anti-DDoS Origin instance. You can view the following information: Mitigation, Blackhole Filtering Event, IP Address Under Mitigation, and IP Address Under Blackhole Filtering.
Peak Attack Throughput: displays the trends of peak traffic of attacks detected by the Anti-DDoS Origin instance.
Attacked Duration: displays the trends of attacks by duration. The durations include Less Than 10 Minutes, 10-30 Minutes, 30-120 Minutes, 2-10 Hours, and More Than 10 Hours.
In the upper-right corner above a chart, you can specify a time range to query related data. You can select Last 1 Week, Last 1 Month, Last 3 Months, or Last 1 Year to query related data.