The Business Monitoring page shows the protection data for your Anti-DDoS Origin instance: traffic trends for protected assets and detected DDoS attack events. Use this page to assess your service's security posture and investigate attack events.
The Business Monitoring page supports data generated on and after June 3, 2021. To query data generated before that date, use the Manage instances page.
Prerequisites
Before you begin, ensure that you have:
A purchased Anti-DDoS Origin instance. See Purchase an Anti-DDoS Origin instance.
Protected assets added to the instance. See Add an object for protection.
View service monitoring data
Log on to the Traffic Security console.
In the left-side navigation pane, choose Network Security > Anti-DDoS Origin > Business Monitoring.
In the top navigation bar, select the resource group and region for your instance.
Instance type Region selection Anti-DDoS Origin 1.0 (Subscription) Select the region where the instance resides Anti-DDoS Origin 2.0 (Subscription) Select All Regions Anti-DDoS Origin 2.0 (Pay-as-you-go) Select All Regions In the upper-left corner, select the Anti-DDoS Origin instance to query.
Review the monitoring data displayed on the page.
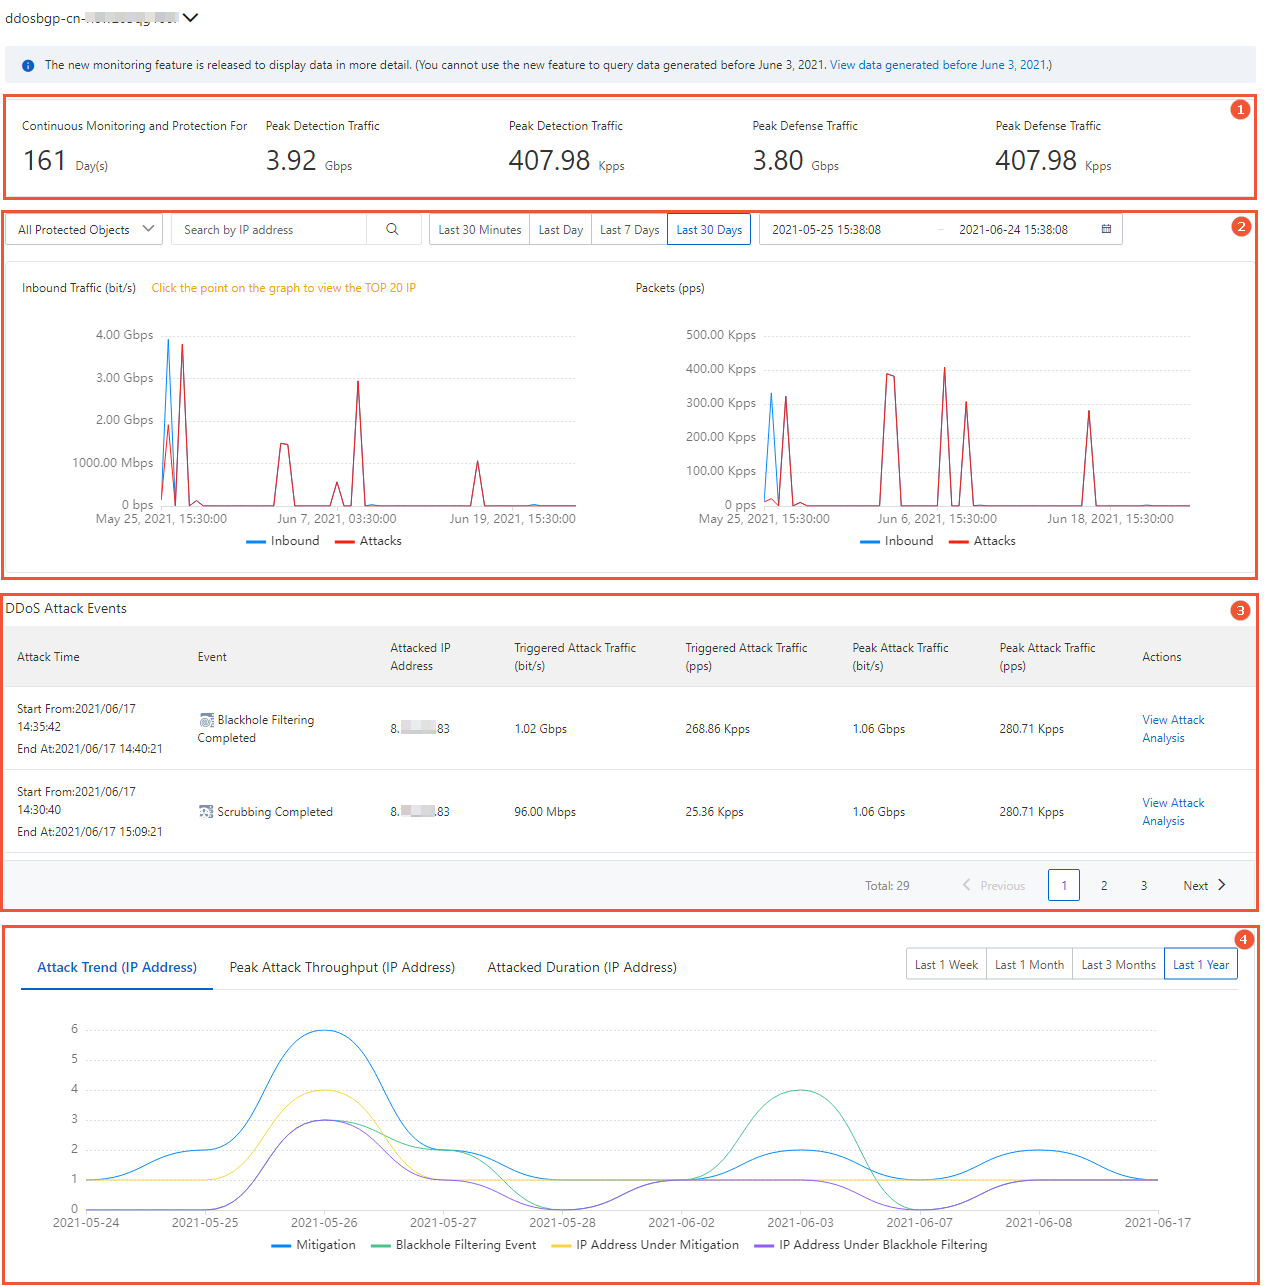
The page is organized into four sections:
| Section | Name | What it shows |
|---|---|---|
| Section 1 | Service statistics | Historical peak traffic statistics for the instance |
| Section 2 | Traffic trend charts | Inbound traffic trends for protected IP addresses |
| Section 3 | DDoS attack events | Attack event list with details and actions |
| Section 4 | Attack trend charts | Network attack trends over the past year |
Service statistics
This section displays three cumulative metrics for the instance:
| Metric | Description |
|---|---|
| Continuous Monitoring and Protection For | The number of days the instance has been protecting your assets |
| Detection Traffic Peak | The highest traffic volume of your service detected by the instance, in bit/s and pps |
| Mitigation Traffic Peak | The highest attack traffic volume detected by the instance, in bit/s and pps |
Traffic trend charts
This section provides two charts:
Inbound Traffic (bit/s): Trends of inbound and outbound traffic for protected IP addresses, showing total traffic and attack traffic separately.
Packets (pps): Trends of packet forwarding rates in both directions for protected IP addresses, showing all packets and attack packets separately.
Filter the data
Use the following filters to narrow the results:
Protected object: Select All Protected Objects from the drop-down list, or enter a specific protected IP address in the search box. When All Protected Objects is selected, click any point on a trend chart to see the top 20 protected IP addresses by traffic volume at that point in time.
Time range: Select Last 30 Minutes, Last Day, Last 7 Days, or Last 30 Days. To specify a custom range, use the date picker. Custom time ranges must fall within the last 30 days.
DDoS attack events
This section lists all attack events detected by the instance. Each entry includes:
| Column | Description |
|---|---|
| Attack Time | When the attack was detected |
| Event | The type of event (traffic scrubbing or blackhole filtering) |
| Attacked IP Address | The protected IP address that was targeted |
| Triggered Attack Traffic (bit/s) | Attack traffic rate at trigger time, in bit/s |
| Triggered Attack Traffic (pps) | Attack traffic rate at trigger time, in pps |
| Peak Attack Traffic (bit/s) | Highest attack traffic rate recorded, in bit/s |
| Peak Attack Traffic (pps) | Highest attack traffic rate recorded, in pps |
Actions on attack events
For each event, the following actions are available:
Cancel Scrubbing: Available only for in-progress traffic scrubbing events. If a traffic surge is caused by a legitimate event (such as a promotional campaign) rather than an attack, cancel scrubbing to restore normal traffic handling.
Download: Download packet capture files for the event. Use these files as evidence when reporting to network supervisors.
View Attack Analysis: Open the attack analysis report for the event. For details, see View information on the Attack Analysis page.
To filter the event list, set the protected object and time range filters in the Traffic trend charts section.
Attack trend charts
This section shows network attack trends detected by the instance over the past year, with three charts:
| Chart | What it shows |
|---|---|
| Attack Trend | Number of attacks over time, broken down by Mitigation, Blackhole Filtering Event, IP Address Under Mitigation, and IP Address Under Blackhole Filtering |
| Peak Attack Throughput | Peak attack traffic over time |
| Attacked Duration | Distribution of attacks by duration: Less Than 10 Minutes, 10-30 Minutes, 30-120 Minutes, 2-10 Hours, and More Than 10 Hours |
To filter each chart, select a time range from the upper-right corner: Last 1 Week, Last 1 Month, Last 3 Months, or Last 1 Year.