The data lineage feature in DataWorks visualizes the lineage of sensitive data. It automatically analyzes abnormal associations between fields and identifies fields with incorrect identification results. This helps you understand the spread and impact of sensitive data and improves identification efficiency. This topic describes how to view a data lineage graph.
Background
The data lineage feature provides the following capabilities:
Visualized lineage graph
Data Security Guard provides a lineage graph that shows the relationships between sensitive fields. This graph helps you clearly understand the source and destination of your data.
Improved efficiency in data identification
Automatic sensitive data identification tasks can use field lineage to propagate identification results to other fields that contain the same type of sensitive data. This greatly improves identification efficiency.
Analysis of abnormal lineage
Analysis of fields with abnormal associations
The system automatically analyzes abnormal associations between sensitive fields, such as those created by SELECT_CONCAT and SELECT_SUBSTRING operations. This prevents users from bypassing sensitive data identification and usage audits by concatenating or splitting character strings.
Analysis of associated fields with inconsistent identification results
This feature helps you identify associated fields that have inconsistent identification results. For example, if you query a field A that is identified as a name, and it has lineage relationships with field B (also a name) and field C (a province), field C is considered to have an inconsistent result.
Limits
Only users of DataWorks Enterprise Edition can use the data lineage feature. For more information, see Editions and billing.
Go to the Data Lineage page
Go to Data Security Guard.
Go to the DataStudio page.
Log on to the DataWorks console. In the top navigation bar, select the desired region. In the left-side navigation pane, choose . On the page that appears, select the desired workspace from the drop-down list and click Go to Data Development.
Click the
 icon in the upper-left corner. Then, choose . On the page that appears, click Try Now to go to the Data Security Guard page. Note
If your Alibaba Cloud account is granted the required permissions, you can directly access the homepage of Data Security Guard.
If your Alibaba Cloud account is not granted the required permissions, you are redirected to the authorization page of Data Security Guard. You can use the features of Data Security Guard only after your Alibaba Cloud account is granted the required permissions.
Go to the Data Lineage page.
You can go to the Data Lineage page in one of the following ways:
Go to the View and Manually Correct Sensitive Data Identification Results page. Find the field whose lineage you want to view and click Lineage Analysis in the Operation column to open the Data Lineage page.
In Data Security Guard, click Data Lineage in the navigation pane on the left. The Data Lineage page appears.
View the data lineage graph
The Data Lineage page visualizes the lineage of sensitive data.
Category | Description |
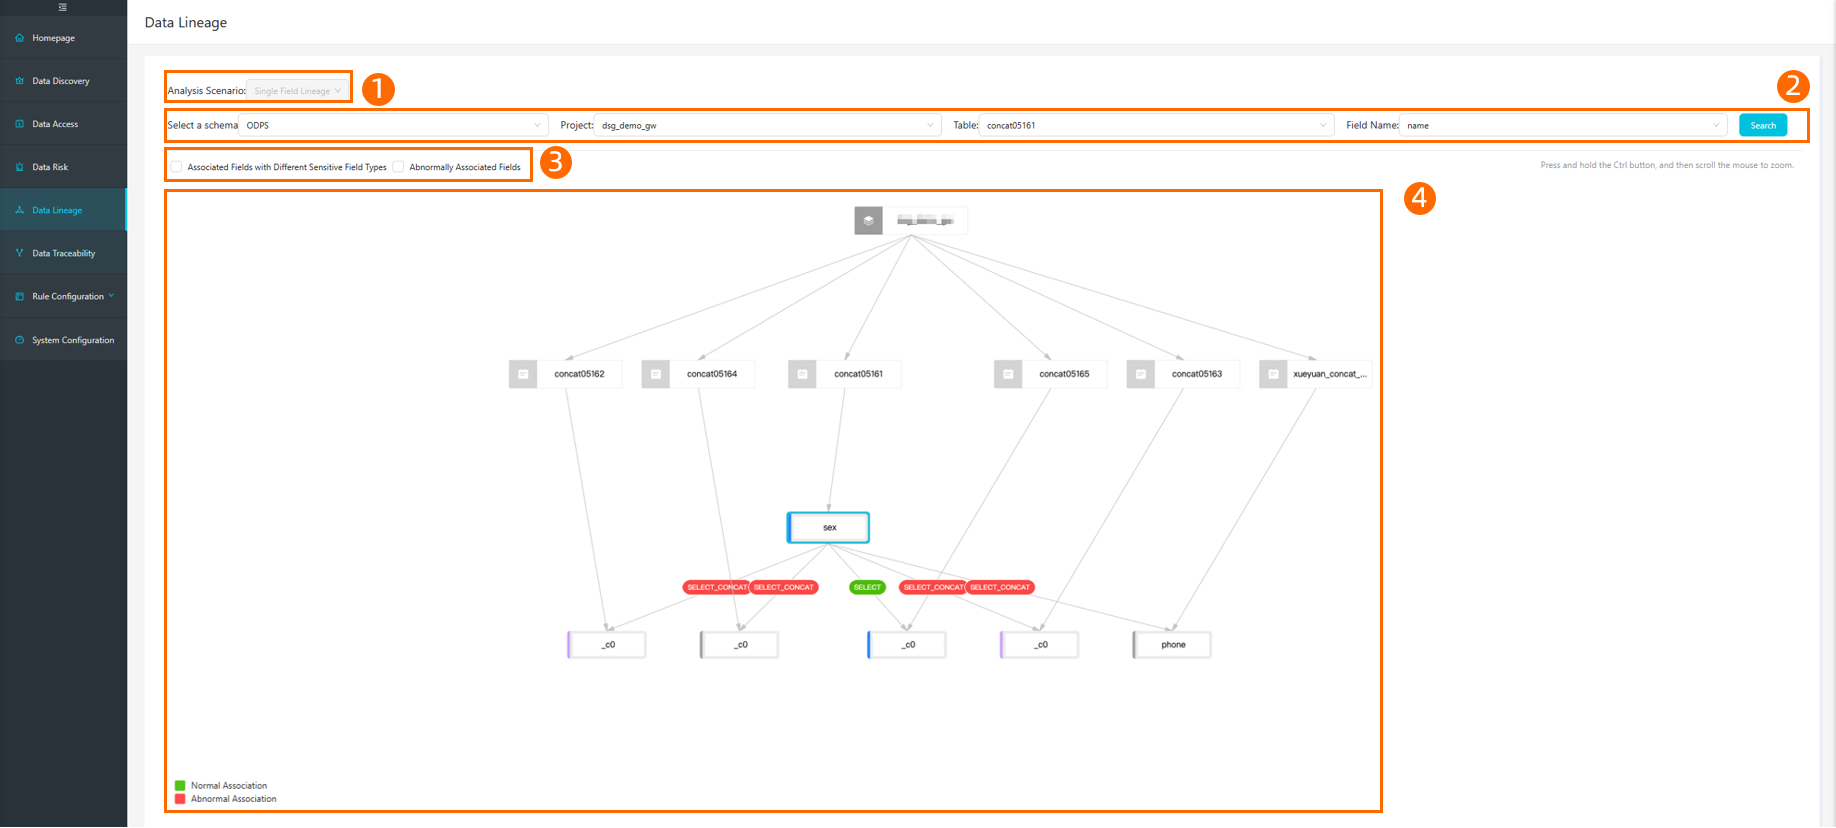
Analysis Scenario | The default analysis scenario is lineage of a single field. More analysis scenarios will be available in the future. |
Filter | In area ② of the preceding figure, you can Select a schema. Enter the Project, Table, and Field Name of the field that you want to query, and click Search. The page displays one level of lineage for the field. The queried field is highlighted. |
Filter conditions | In area ③ of the preceding figure, you can select filter conditions as needed:
|
Data lineage graph | Area ④ in the preceding figure displays a one-level data lineage graph for the queried field. You can click a field or the edge relationship button between fields to view field and edge information.
|
Correct data in batches
You can correct inaccurate identification results for multiple fields in one of the following ways:
In the data lineage graph, view the upstream and downstream fields associated with the current field. Then, select multiple fields and correct their identification results.
Go to the Manually Correct Data page. Then, select multiple fields and correct their identification results. For more information, see View and Manually Correct Sensitive Data Identification Results.