The Quality Dashboard gives data quality owners a single-page view of their workspace's data health: key metrics, rule-based check trends, the tables with the most issues, and monitoring coverage gaps.
Open the Quality Dashboard
-
Log on to the DataWorks console. In the top navigation bar, select the target region. In the left-side navigation pane, choose Data Governance > Data Quality.
-
Select the target workspace from the drop-down list, then click Go to Data Quality.
-
In the left-side navigation pane of the Data Quality page, click Quality Dashboard.
Usage notes
The Quality Dashboard shows statistics for a single workspace. Three filters control which data is included:
Time range — In the upper-right corner, select Today (default), Yesterday, The Day Before Yesterday, or a specific date.
Environment — Select View Only Data in Production Environment to exclude development environment check results from all statistics.
This option applies only to workspaces in standard mode, which maintain separate development and production environments. All tables in a basic mode workspace are in the production environment by default. For details, see Comparison of basic mode and standard mode.
Data source — Select All (default) to include all data source types, or pick a specific source: MaxCompute, E-MapReduce, Hologres, CDH Hive, AnalyticDB for PostgreSQL, AnalyticDB for MySQL, StarRocks, or MySQL.
Statistics on streaming data are not supported.
Main data quality metrics
In the Highlights section, click Rules or Tables to switch between the two metric views.
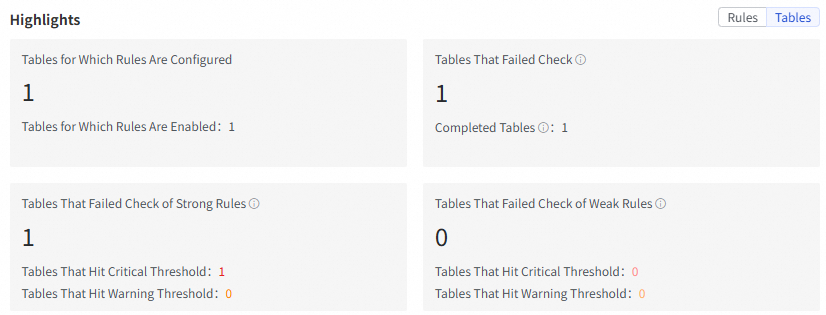
Tables view
| Metric | Description |
|---|---|
| Tables for which rules are configured | Number of tables with monitoring rules configured, as of the selected date |
| Tables that failed check | Tables that failed a rule-based check on the current day (includes both quality threshold failures and system check failures). Completed Tables shows the total for which check instances finished running. The running of rule-based check instances is considered complete in the following scenarios: tables passed the quality check, tables failed the quality check, and tables failed the system check. |
| Tables that failed check of strong rules | Tables that failed a strong monitoring rule on the current day. Tables That Hit Critical Threshold and Tables That Hit Warning Threshold break this down by severity. |
| Tables that failed check of weak rules | Tables that failed a weak monitoring rule on the current day. Tables That Hit Critical Threshold and Tables That Hit Warning Threshold break this down by severity. |
Rules view
| Metric | Description |
|---|---|
| Total rules | Total monitoring rules created in the workspace as of the current day |
| Rules based on which tables failed check | Rules under which at least one table failed a check on the current day (includes quality threshold and system check rules). Completed Rules shows rules for which check instances finished running. The running of rule-based check instances is considered complete in the following scenarios: tables passed the quality check, tables failed the quality check, and tables failed the system check. |
| Strong rules based on which tables failed check | Strong rules under which tables failed. Rules Based on Which Tables Hit Critical Threshold and Rules Based on Which Tables Hit Warning Threshold break this down by severity. |
| Weak rules based on which tables failed check | Weak rules under which tables failed. Rules Based on Which Tables Hit Critical Threshold and Rules Based on Which Tables Hit Warning Threshold break this down by severity. |
Overview of rule-based check
The Quality Monitoring Overview section shows the trend and distribution of rule-based check instances.
Instance trend analysis
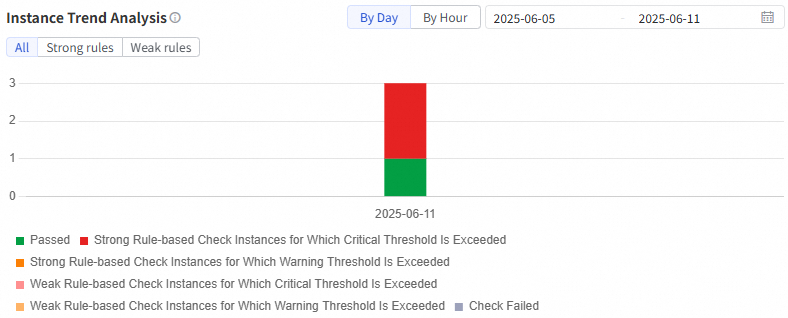
This chart shows how check instance counts change over time, grouped by check result. Toggle between By Day and By Hour views. Filter by All, Strong rules, or Weak rules to narrow the scope.
Instance running status
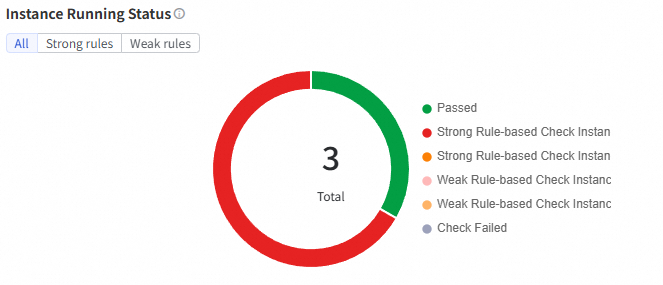
This chart shows the distribution of check instances by result for the current day. The same All / Strong rules / Weak rules filter applies. Possible check results:
| Result | Meaning |
|---|---|
| Passed | Check ran successfully and the table met the quality threshold |
| Strong Rule-based Check Instances for Which Critical Threshold Is Exceeded | A strong rule's critical threshold was exceeded |
| Strong Rule-based Check Instances for Which Warning Threshold Is Exceeded | A strong rule's warning threshold was exceeded |
| Weak Rule-based Check Instances for Which Critical Threshold Is Exceeded | A weak rule's critical threshold was exceeded |
| Weak Rule-based Check Instances for Which Warning Threshold Is Exceeded | A weak rule's warning threshold was exceeded |
| Check Failed | The check could not run — the system failed to get a check value |
Top N tables with the most quality issues
Based on the ranking of the numbers of monitoring rules for tables, the Top N Tables with Maximum Number of Quality Issues section ranks tables by the number of quality issues within the selected time range. The Owners of Top N Tables with Maximum Number of Quality Issues section lists the responsible owners.
Click View more in the upper-right corner to go to the Running Records page, where you can review check history, inspect check details, and act on issues.
The owner of a monitoring rule is the data quality owner of the table's partition — typically the user who created the partition filter expression.
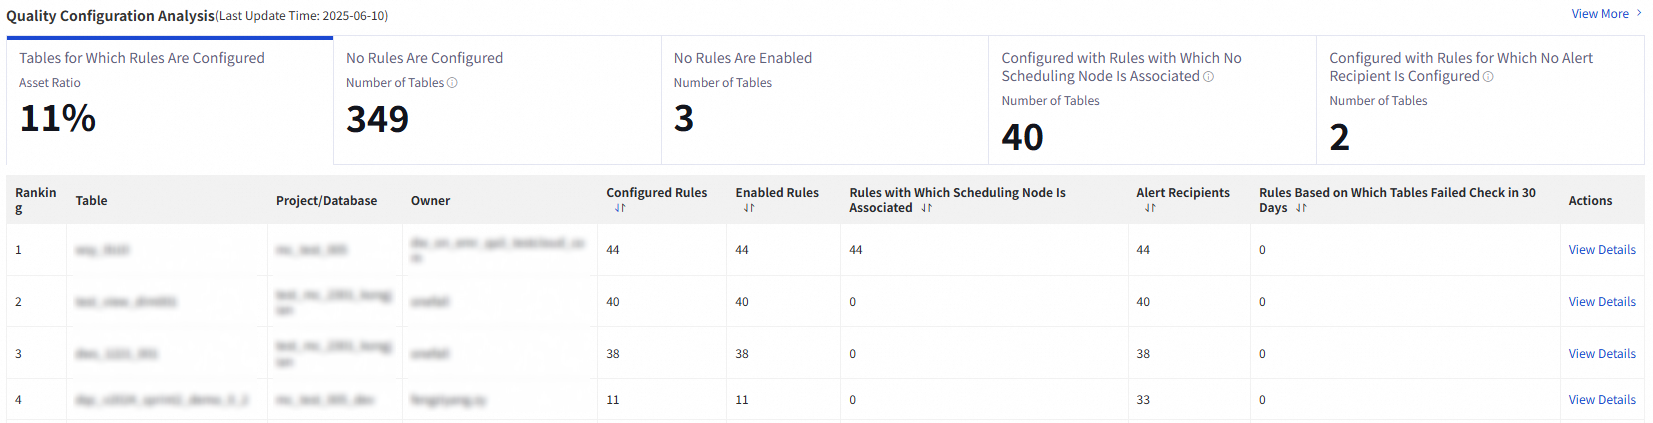
Data quality configuration analysis
The Quality Configuration Analysis section surfaces monitoring coverage gaps across five dimensions. Click View Details in the Actions column to see which specific tables fall into each category.
| Dimension | Tables included | Why it matters |
|---|---|---|
| Asset ratio of tables for which rules are configured | All tables, showing what percentage have rules | Shows overall rule coverage |
| Number of tables for which no rules are configured | Tables with no monitoring rule configured | Tables with no rules receive no quality checks. Supported for MaxCompute data sources only. |
| Number of tables for which no rules are enabled | Tables that have rules but none are enabled | Disabled rules produce no check results |
| Number of tables configured with rules with which no scheduling node is associated | Tables whose rules have no linked scheduling node | Rules without a scheduling node can only be executed in a test run |
| Number of tables configured with rules for which no alert recipient is configured | Tables whose rules have no alert recipient set | Without an alert recipient, no one is notified when a quality issue occurs |