The Running Records page in Data Quality shows the validation results for all monitoring jobs. After a job runs, use this page to review check results, investigate anomalies, and record handling decisions.
Navigate to Running Records
-
Log on to the DataWorks console. In the top navigation bar, select the target region. In the left navigation pane, choose Data Governance > Data Quality.
-
Select the target workspace from the drop-down list, then click Go to Data Quality.
-
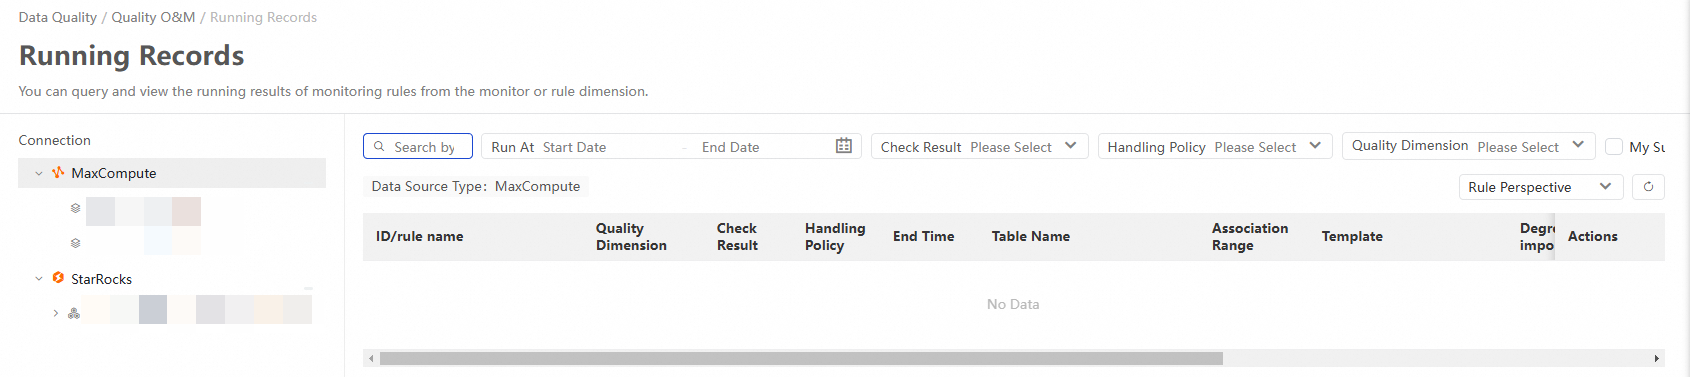
In the left navigation pane, click Quality O&M > Running Records.
On the Running Records page, filter jobs by Data Source, Table Name, Check Result, Handling Policy, or My Subscriptions.
View monitoring jobs
The Running Records page offers two perspectives. In the upper-right corner, click Perspective to switch between them.
Rule perspective
| Field | Description |
|---|---|
| ID/rule name | The ID and name of the quality rule. |
| Check Result | The data validation result. See Check results for status descriptions. |
| Handling Policy | Whether the scheduling task is blocked: Alert or Blocks. |
| End Time | The time when data validation ended. |
| Table Name | The target table for data validation. |
| Association Range | Whether the rule applies at the table level or Field Level level. |
| Template | The rule template used by the quality rule. |
| Degree of importance | The rule's importance level: Strong rule or Soft rule. A strong rule blocks the associated scheduling task by default when a red abnormal result occurs. A soft rule does not block the task by default. |
| Monitoring Threshold | The comparison method and threshold range of the rule. |
| Details (action) | Click to view Running Record This Time, History Run Record, Problem data processing, and Raw Log for the rule. To record a handling decision, click Problem Handling, select a Handling Method, enter Comments, and click Confirm. |
| Rule (action) | Click to go to the table quality details page and view all rules associated with the quality rule task. |
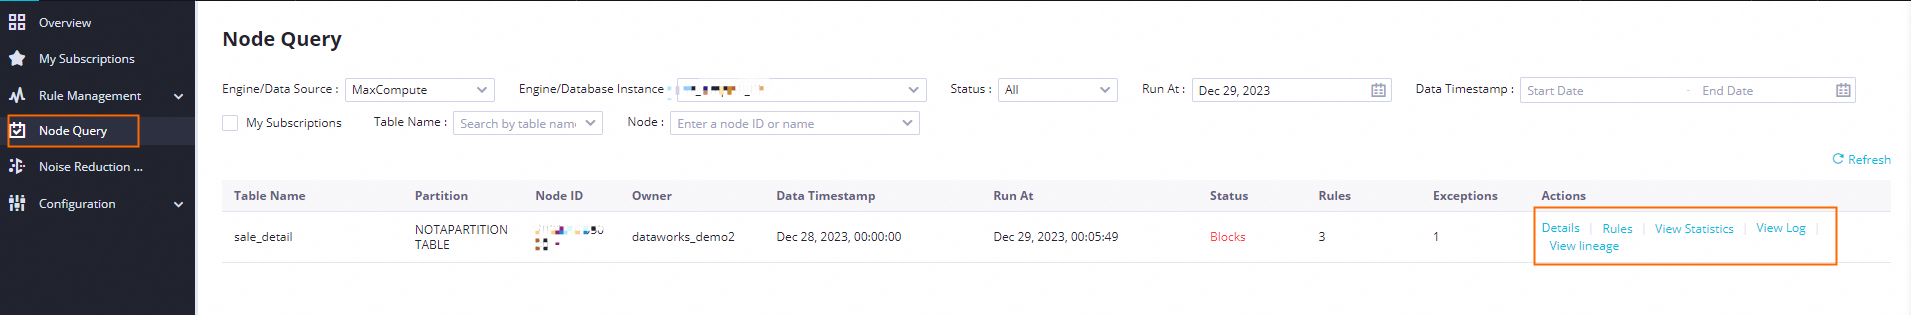
Monitor perspective
| Field | Description |
|---|---|
| Table Name | The target table that the monitoring job validates. |
| Monitor | The name of the monitoring job. |
| Check Result | The monitoring job result. See Check results for status descriptions. |
| Handling Policy | Whether the monitoring job is blocked: Alert or Blocks. |
| Start Time | The time when the monitoring job started. |
| Timestamp Range | The target partition of the table that the monitoring job validates. |
| Trigger Method | How the monitoring job was triggered: Production Scheduling Trigger or Triggered Manually. |
| Data Timestamp | The business time corresponding to the partition specified by the timestamp range. |
| Details (action) | Click to view all validation rules for the monitoring job. Select a rule to see Running Record This Time, History Run Record, Problem data processing, and Raw Log. To record a handling decision, click Problem Handling for the rule, select a Handling Method, enter Comments, and click Confirm. |
| Rule (action) | Click to go to the table quality details page and view all rules associated with the quality rule task. |
| View lineage (action) | Click to open Data Map and view the data lineage for the table. |
Check results
Both perspectives use the same check result statuses.
| Status | Description |
|---|---|
| Passed | The data validation meets expectations — the result satisfies the quality rule. |
| Orange Abnormal | The validation metric hits the orange threshold. This usually means the data is abnormal but does not affect subsequent business operations. |
| Red Abnormal | The validation metric hits the red threshold. This usually means the data does not meet expectations and will severely affect subsequent business operations. |
| Checking | The monitoring job is in progress. |
| Check Failed | The validation task failed to run — for example, the monitored partition was not generated, or the SQL script used for monitoring failed. |