The DataAnalysis feature in DataWorks provides comprehensive data analysis and sharing capabilities. You can connect to various data sources, run SQL queries, and use tools like Workbooks for your daily data extraction and analysis needs. This tutorial walks you through the basics of DataAnalysis by using a MaxCompute compute engine to query and analyze a public dataset.
Feature overview
DataAnalysis provides public datasets for various business scenarios. This tutorial uses the Alibaba e-commerce dataset (the commerce_ali_e_commerce table) to demonstrate the core features of DataAnalysis.
The Alibaba e-commerce dataset contains order details from Taobao across different time periods.
The table records random user behaviors (including clicks, purchases, adding to cart, and favorites) from approximately one million users between
November 25, 2017andDecember 3, 2017.It includes
987,994users,4,162,024products, and100,150,807recorded behaviors.
To learn more about DataAnalysis, see DataAnalysis.
The public dataset is available in the following regions: China (Shanghai), China (Beijing), China (Shenzhen), China (Hangzhou), China (Chengdu), China (Zhangjiakou), and China (Ulanqab).
Permissions
Ensure you have the required permissions for DataAnalysis. For a complete list of roles and permissions, see Preset roles and permissions for DataAnalysis.
To grant permissions to a user, see Add workspace members and manage their roles.
Prerequisites
A MaxCompute data source is required. For more information, see Associate a MaxCompute compute engine with a workspace.
Navigate to SQL Query
Log on to the DataWorks console. In the top navigation bar, select the desired region. In the left-side navigation pane, choose . On the page that appears, click Go to DataAnalysis. In the left-side navigation pane of the page that appears, click SQL Query.
Step 1: Query data
This example uses the Alibaba e-commerce dataset (commerce_ali_e_commerce) to demonstrate how to use the SQL Query feature to query, sort, analyze, and share data.
Go to the SQL Query page.
You can navigate to the page in one of two ways:
On the Data Analysis homepage, in the Shortcuts section, click SQL Query to open the SQL Query page.
In the Data Analysis module, click SQL Query on the left-side menu bar to go to the SQL Query page.
Create an Temporary File.
In the left-side pane, click the
 icon next to My Files and select Create File. Follow the on-screen instructions to create an SQL query file. For more ways to create an SQL query file, see SQL Query (Legacy).Note
This tutorial uses a public dataset provided by DataWorks. When you first open SQL Query, you can click for MaxCompute on the Welcome Page to generate a query for the Alibaba e-commerce dataset (
commerce_ali_e_commerce).To find more public datasets, go to and browse the Public Data directory.
Select a Data Source for the query.
In the ad hoc query file editor, click the
 icon in the upper-right corner. Select the workspace, compute engine type, and data source for your query. This example uses the MaxCompute data source that you created earlier.
Edit and run the query code.
In the code editor of the ad hoc query file, paste and run the following code.
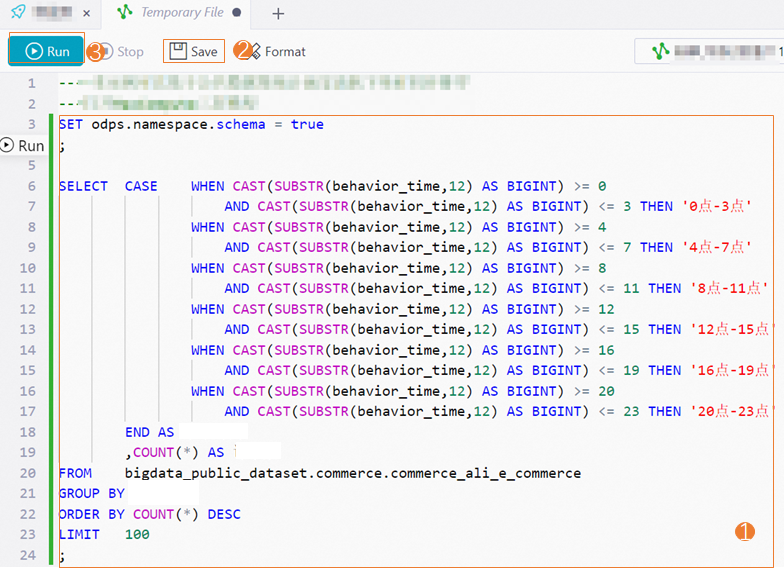
This query calculates and sorts the number of orders from the public dataset by time period.
SET odps.namespace.schema = true
;

SELECT  CASE    WHEN CAST(SUBSTR(behavior_time,12) AS BIGINT) >= 0
                    AND CAST(SUBSTR(behavior_time,12) AS BIGINT) <= 3 THEN '00:00-03:00'
                WHEN CAST(SUBSTR(behavior_time,12) AS BIGINT) >= 4
                    AND CAST(SUBSTR(behavior_time,12) AS BIGINT) <= 7 THEN '04:00-07:00'
                WHEN CAST(SUBSTR(behavior_time,12) AS BIGINT) >= 8
                    AND CAST(SUBSTR(behavior_time,12) AS BIGINT) <= 11 THEN '08:00-11:00'
                WHEN CAST(SUBSTR(behavior_time,12) AS BIGINT) >= 12
                    AND CAST(SUBSTR(behavior_time,12) AS BIGINT) <= 15 THEN '12:00-15:00'
                WHEN CAST(SUBSTR(behavior_time,12) AS BIGINT) >= 16
                    AND CAST(SUBSTR(behavior_time,12) AS BIGINT) <= 19 THEN '16:00-19:00'
                WHEN CAST(SUBSTR(behavior_time,12) AS BIGINT) >= 20
                    AND CAST(SUBSTR(behavior_time,12) AS BIGINT) <= 23 THEN '20:00-23:00'
        END AS `Time at which an order is placed`
        ,COUNT(*) AS `Number of orders`
FROM    bigdata_public_dataset.commerce.commerce_ali_e_commerce
GROUP BY `Time at which an order is placed`
ORDER BY COUNT(*) DESC
LIMIT   100
;
View the query results.
Click the
 icon to run the SQL code.
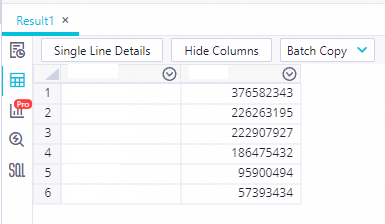
Step 2: Analyze data
On the query results page from Step 1, click the ![]() icon in the left-side navigation pane, and then click the
icon in the left-side navigation pane, and then click the ![]() Edit icon to open the chart editor. You can configure the chart as needed.
Edit icon to open the chart editor. You can configure the chart as needed.
Step 3: Share data
You can share your SQL query results with other users as a Workbook for online collaboration.
Export the query results.
On the query results page from Step 1, click the
 icon in the upper-right corner and select Workbook and Share from the drop-down menu.
Go to the Spreadsheet page.
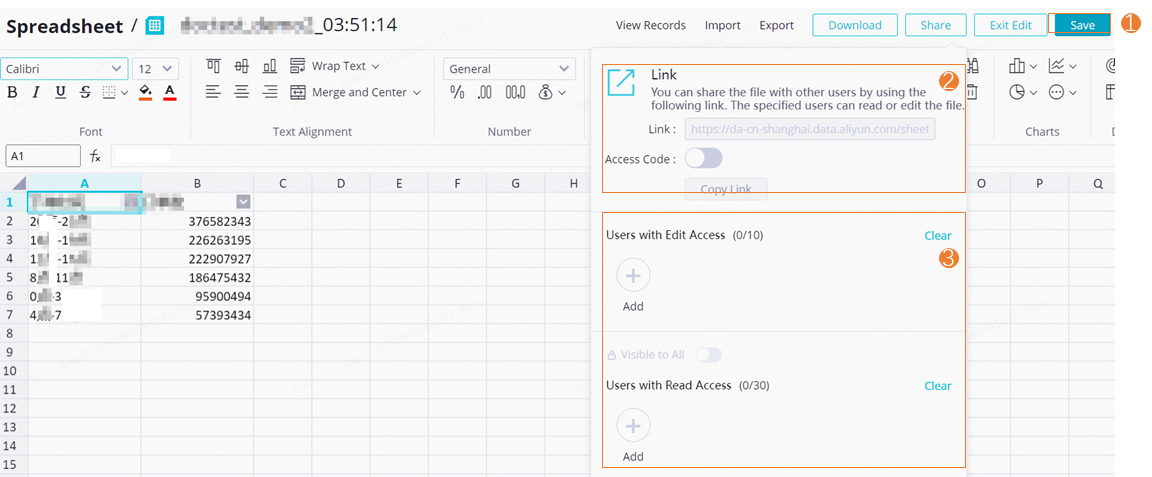
On the Spreadsheet page, you can synchronize the query results. For more information about working with Workbooks, see Workbook.
Share the Workbook.
In the upper-right corner of the page, click Share to share the data with specific users. Recipients can access the Workbook with a URL or an access code. You can grant them either edit or view-only permissions.
Next steps
To learn more about SQL queries, see SQL Query (Legacy).
To learn more about using Workbooks, see Workbook.