To ensure that the table data generated by nodes meets your business requirements, you can configure monitoring rules to monitor the quality of the table data generated by the nodes. This topic describes how to configure a monitor to monitor the data quality of the dwd_log_info_di_emr table.
Prerequisites
Data is synchronized and processed. For more information, see Synchronize data and Process data.
Step 1: Go to the Configure by Table page
Go to the Data Quality page.
Log on to the DataWorks console. In the top navigation bar, select the desired region. In the left-side navigation pane, choose . On the page that appears, select the desired workspace from the drop-down list and click Go to Data Quality.
Go to the Configure by Table page.
In the left-side navigation pane of the Data Quality page, choose . On the Configure by Table page, find the desired table based on the following filter conditions:
In the Connection section, select E-MapReduce.
On the right side of the Configure by Table page, specify filter conditions to find the
dwd_log_info_di_emrtable for which you want to configure monitoring rules.
Find the desired table in the search results and click Rule Management in the Actions column. The Table Quality Details page of the table appears. The following sections describe the configurations of the table.
Step 2: Configure a monitor
You can use a monitor to check whether the quality of data in the specified range (partition) of a table meets your expectations.
In this step, you must set the Data Range parameter of the monitor to dt=$[yyyymmdd-1]. When the monitor is run, the monitor searches for the data partitions that match the parameter value and checks whether the quality of the data meets your expectations.
In this case, each time the scheduling node that is used to write data to the dwd_log_info_di_emr table is run, the monitor is triggered and the monitoring rules that are associated with the monitor are used to check whether the quality of data in the specified range meets your expectations.
You need to perform the following steps:
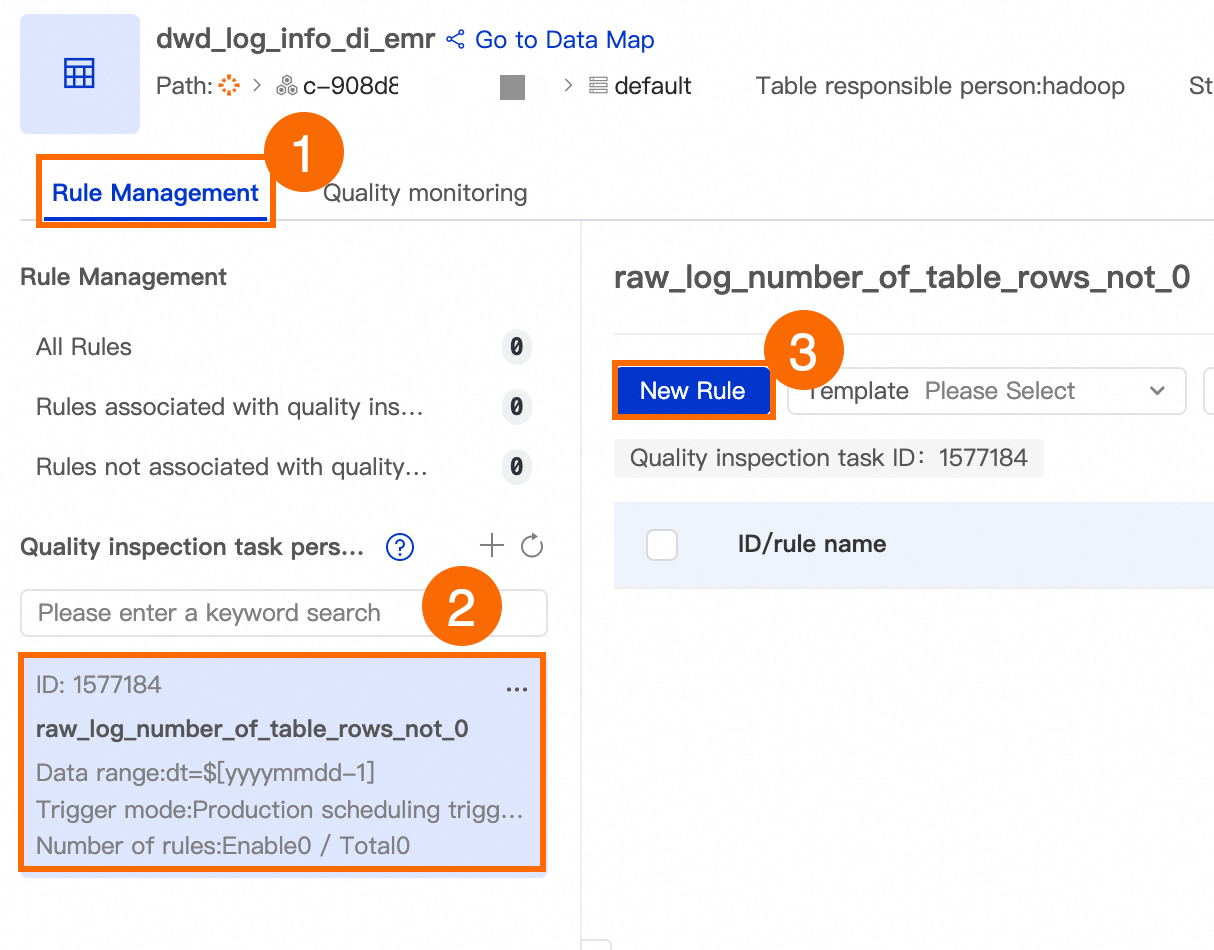
On the Monitor tab, click Create Monitor.
Configure the parameters of the monitor. The following table describes the key parameters.
Parameter
Description
Data Range
dt=$[yyyymmdd-1]
Monitoring Rule
You do not need to configure this parameter. The monitoring rules are configured in the Configure monitoring rules section.
Trigger Method
The trigger method. Set this parameter to Triggered by Node Scheduling in Production Environment and select the
dwd_log_info_di_emrnode that is created during data processing.NoteFor more information about how to configure a monitor, see Configure a monitoring rule for a single table.
Step 3: Configure monitoring rules
The dwd_log_info_di_emr table is used to process the data of the ods_raw_log_d_emr table. To prevent invalid data processing and data quality issues, you need to create and configure a strong rule that monitors whether the number of rows in the dwd_log_info_di_emr table is greater than 0. This rule helps you determine whether the ancestor node writes data to the partitions of the dwd_log_info_di_emr table.
If the number of rows in the related partitions of the dwd_log_info_di_emr table is 0, an alert is triggered, the dwd_log_info_di_emr node fails and exits, and the descendant nodes of the dwd_log_info_di_emr node are blocked from running.
You need to perform the following steps:
In the Monitor Perspective section of the Rule Management tab, select a monitor. In this example, the
raw_log_number_of_table_rows_not_0monitor is selected. Then, click Create Rule. The Create Rule panel appears.
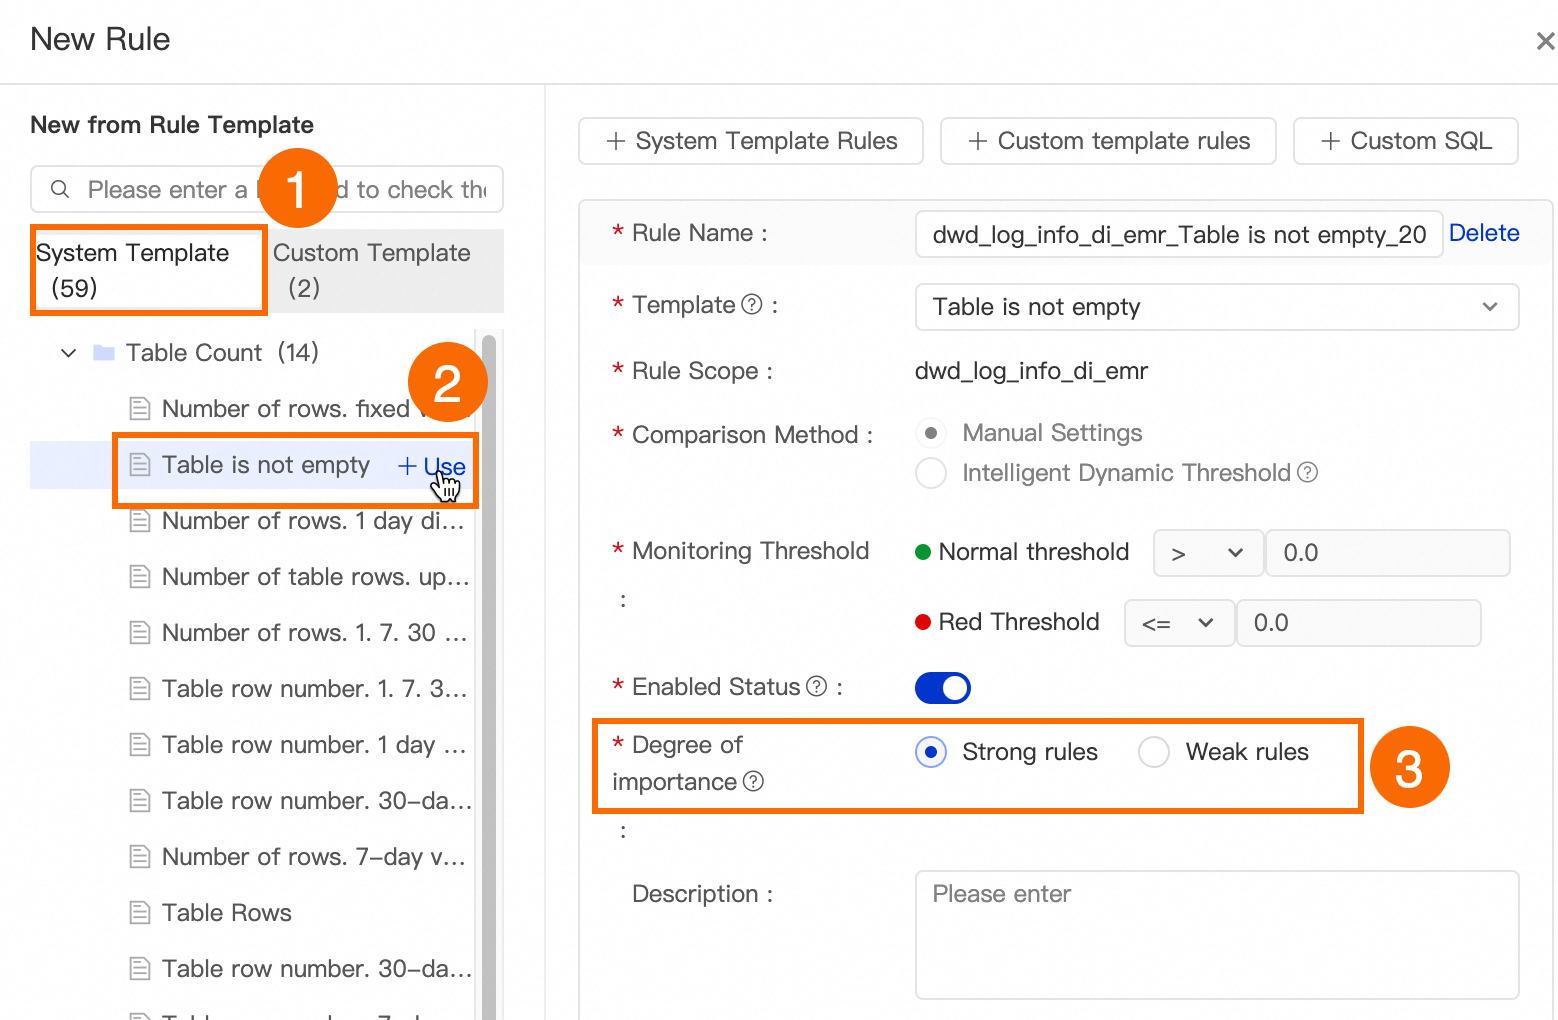
On the System Template tab of the Create Rule panel, find the Table is not empty rule and click Use. On the right side of the panel, set the Degree of Importance parameter to Strong Rule.
NoteIn this example, the rule is defined as a strong rule. This indicates that when the number of rows in the
dwd_log_info_di_emrtable is found to be 0, an alert is triggered and the descendant nodes are blocked from running.
Click Determine.
NoteFor information about other parameters configured for a monitoring rule, see Configure a monitoring rule for a single table.
Step 4: Perform a test run on the monitor
You can perform a test run to verify whether the configurations of the monitoring rules that are associated with the monitor work as expected. To ensure that the configurations of the rules are correct and meet your expectations, perform a test run on the monitor after you create the rules that are associated with the monitor.

Click Test Run. The Test Run dialog box appears.
In the Test Run dialog box, configure the Scheduling Time parameter and click Test Run.
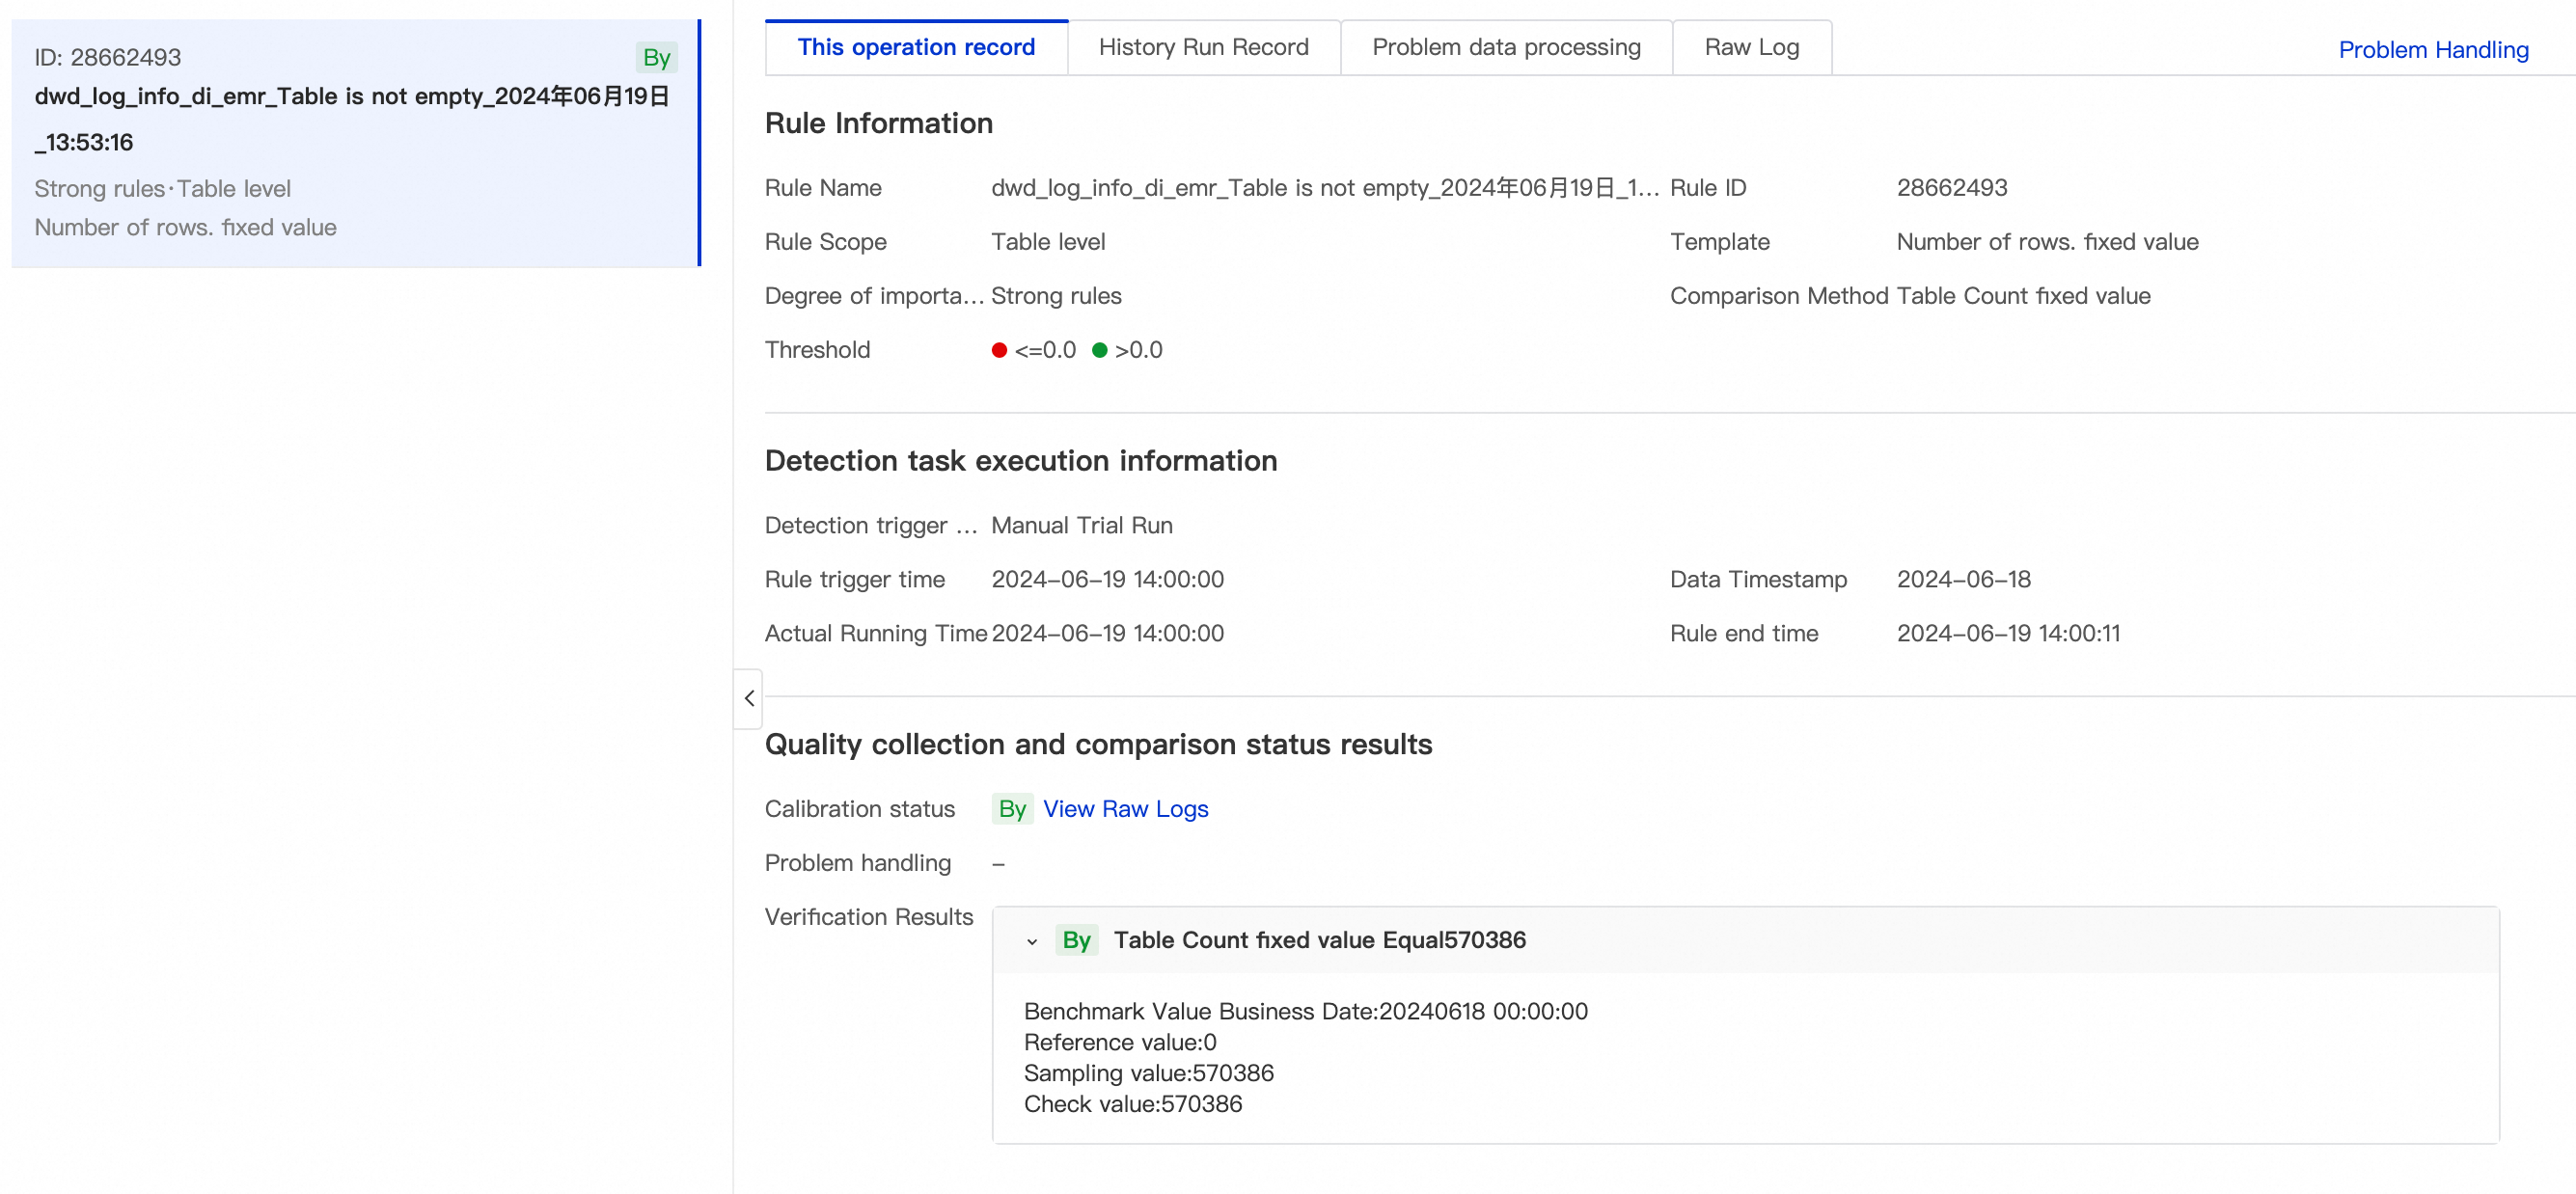
After the test run is complete, click View Details to view the test result.

Step 5: Subscribe to the monitor
Data Quality provides the monitoring and alerting feature. You can subscribe to monitors to receive alert notifications about data quality issues. This way, you can resolve the data quality issues at the earliest opportunity and ensure data security, data stability, and the timeliness of data generation.
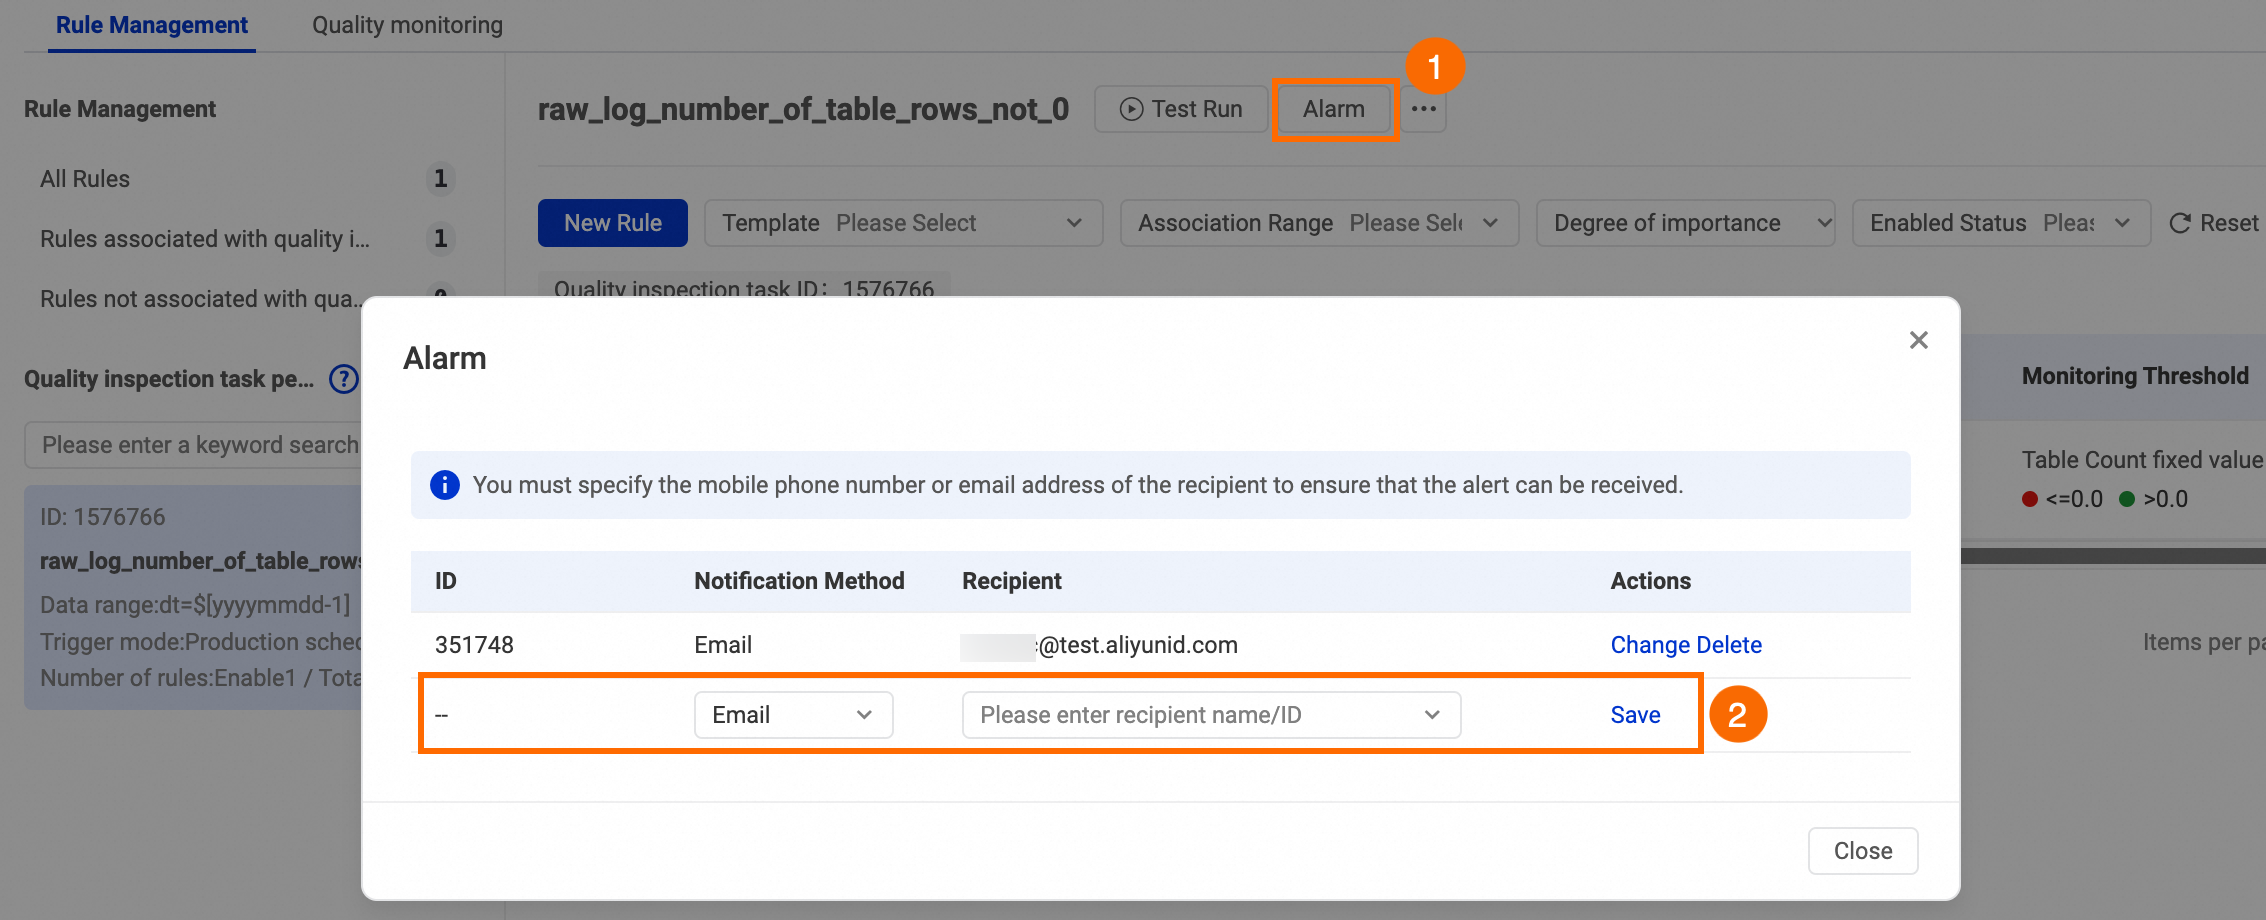
On the Rule Management tab, click Alert Subscription. In the Alert Subscription dialog box, select a notification method and a recipient, and click Save in the Actions column.

View and modify the subscribed monitor.
After the subscription configuration is complete, choose in the left-side navigation pane. Then, click My Subscriptions on the Monitor page to view and modify the subscribed monitors.
What to do next
After the data is processed, you can use DataAnalysis to visualize the data. For more information, see Visualize data on a dashboard.