Monitoring rules are the core of Data Quality (DQC). Data Quality (DQC) continuously checks your MaxCompute tables against rules you define — catching row count anomalies, null rates, and value range violations before they reach downstream consumers. This topic walks through the end-to-end setup: connecting a MaxCompute data source, creating a monitoring task, writing rules, testing them, and enabling alerts.
Data Quality supports monitoring for MaxCompute, EMR (E-MapReduce), Hologres, AnalyticDB for PostgreSQL, and AnalyticDB for MySQL.
How it works
A complete quality monitoring setup involves four linked components:
| Component | Role |
|---|---|
| Data source | A MaxCompute table registered in DataWorks |
| Quality monitoring task | Defines which table to monitor and when to trigger checks |
| Monitoring rules | The specific checks run against the table (row counts, null rates, value ranges, and so on) |
| Alert subscription | Notifies the right people when a rule violation occurs |
After you associate a quality monitoring task with a node in Operation Center, rules run automatically each time that node finishes.
Prerequisites
Before you begin, ensure that you have:
-
A DataWorks workspace with MaxCompute enabled
-
Permission to access Management Center and Data Quality in the DataWorks console
Step 1: Add a MaxCompute data source
-
Log on to the DataWorks console. In the top navigation bar, select the region. In the left-side navigation pane, choose More > Management Center. Select your workspace from the drop-down list and click Go to Management Center.
-
In the left-side navigation pane of the SettingCenter page, click Data Sources.
-
Click Add Data Source and add a MaxCompute data source. For details, see Bind a MaxCompute computing resource.
-
In the upper-left corner, click the
 icon and choose All Products > Data Development and O&M > DataStudio (Data Development).
 -
In the left-side navigation pane of the Data Studio page, click Computing Resources and bind the MaxCompute computing resource you added.
This topic uses test data from the MaxCompute public dataset. For production tables, configure quality monitoring rules based on your actual business requirements.
Step 2: Go to the table quality details page
-
In the upper-left corner, click the
icon and choose All Products > Data Governance > Data Quality. -
In the left-side navigation pane, click Rule Configuration > Configure by Table.
-
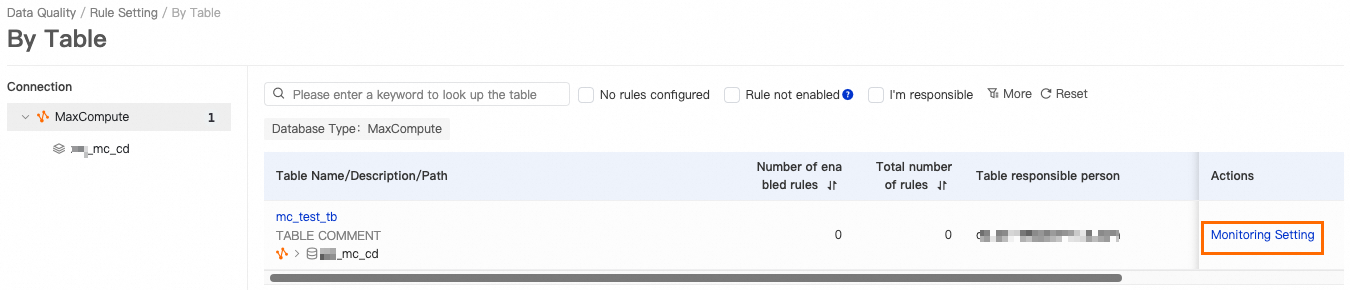
In the Data Source list, select a database. Find the table to monitor, then click the table name or click Configure Monitoring Rule in the Actions column. The Table Quality Details page opens.
NoteTo find a table quickly, enter its name in the search box. Fuzzy search using the first letter of the table name is supported.
Step 3: Create a quality monitoring task
A quality monitoring task defines the monitoring scope and trigger conditions for a set of rules.
-
On the Rule Management tab of the Table Quality Details page, click the
 icon next to Monitor Perspective. The Create Quality Monitoring page opens.
 -
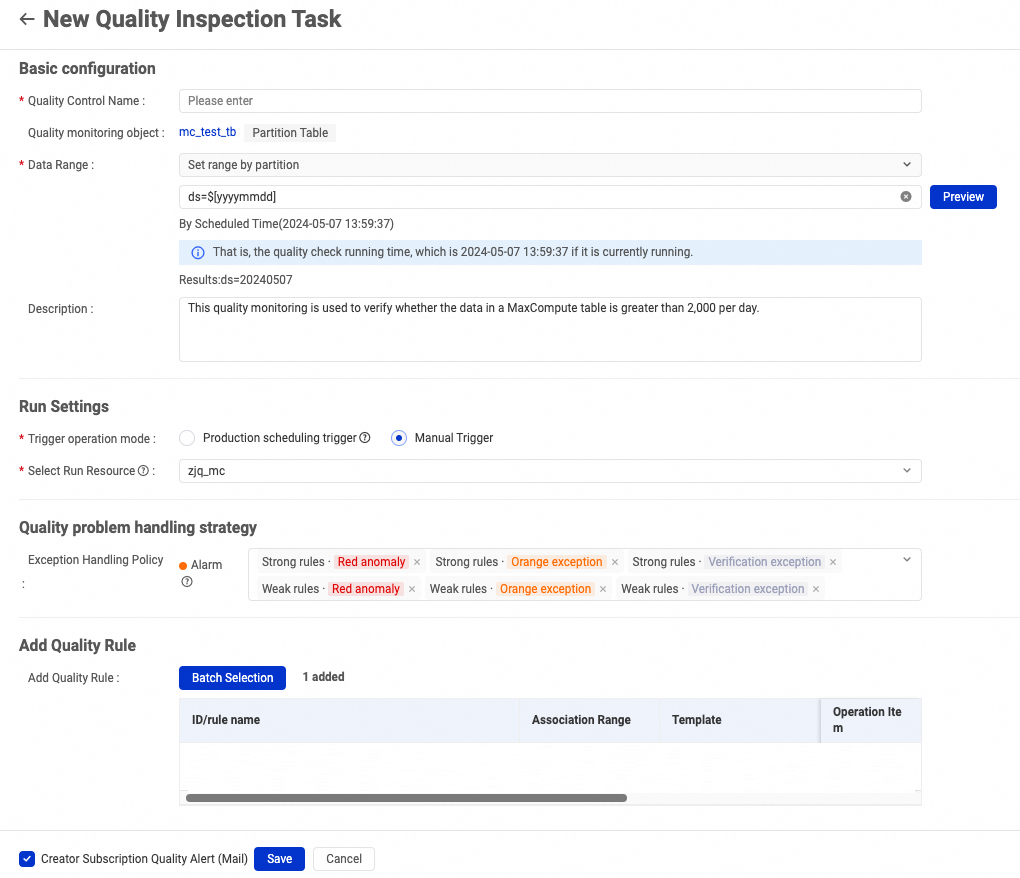
Configure the parameters for the quality monitoring task.
NoteCreate the task based on the verification requirements of your table. For parameter details, see Configure rules for a single table.
-
Click Save.
Step 4: Configure Data Quality rules
Rules define the specific checks to run — for example, whether a column contains null values or whether the row count falls within an expected range.
-
On the Rule Management tab of the Table Quality Details page, click Create Rule. The rule configuration page opens.
-
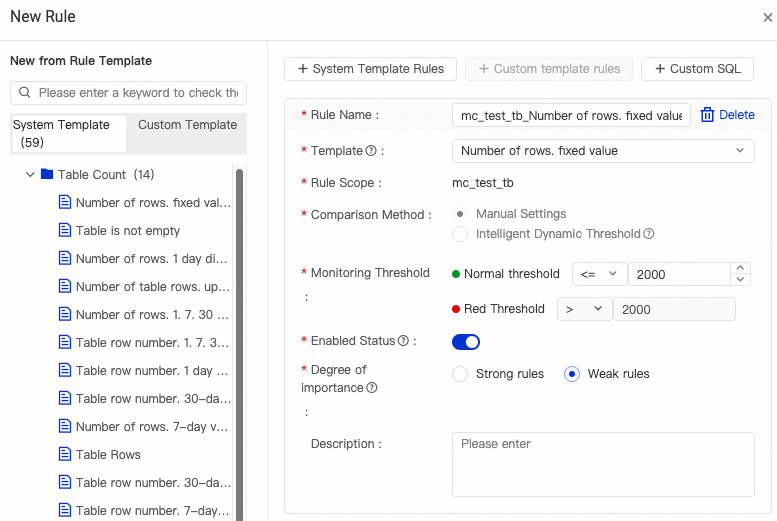
Select a system template to create a Data Quality rule.
NoteCreate rules based on your table's data quality requirements. For a full list of rule types and template options, see Configure rules for a single table.
-
Add the rule to the quality monitoring task you created in Step 3.

-
Click OK.
Step 5: Test the rule execution
Run a one-time test before enabling scheduled monitoring to confirm the rule is correctly configured.
-
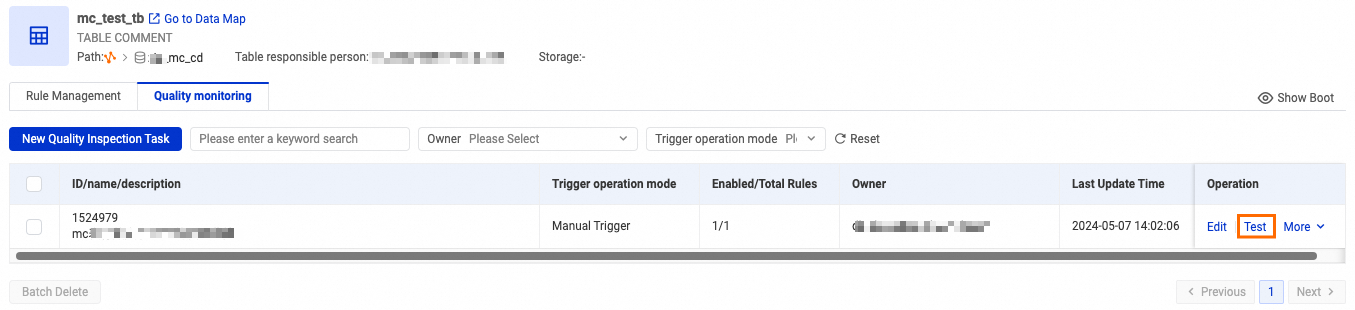
On the Monitor tab of the Table Quality Details page, find the quality monitoring task and click Test in the Actions column.
-
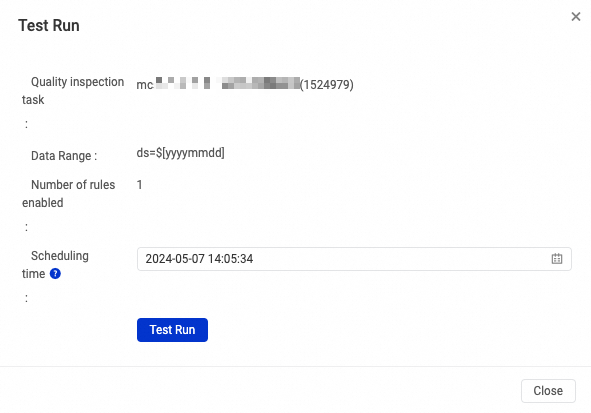
In the Test Run dialog box, confirm the Timestamp Range and Scheduled Time, then click Test Run.
-
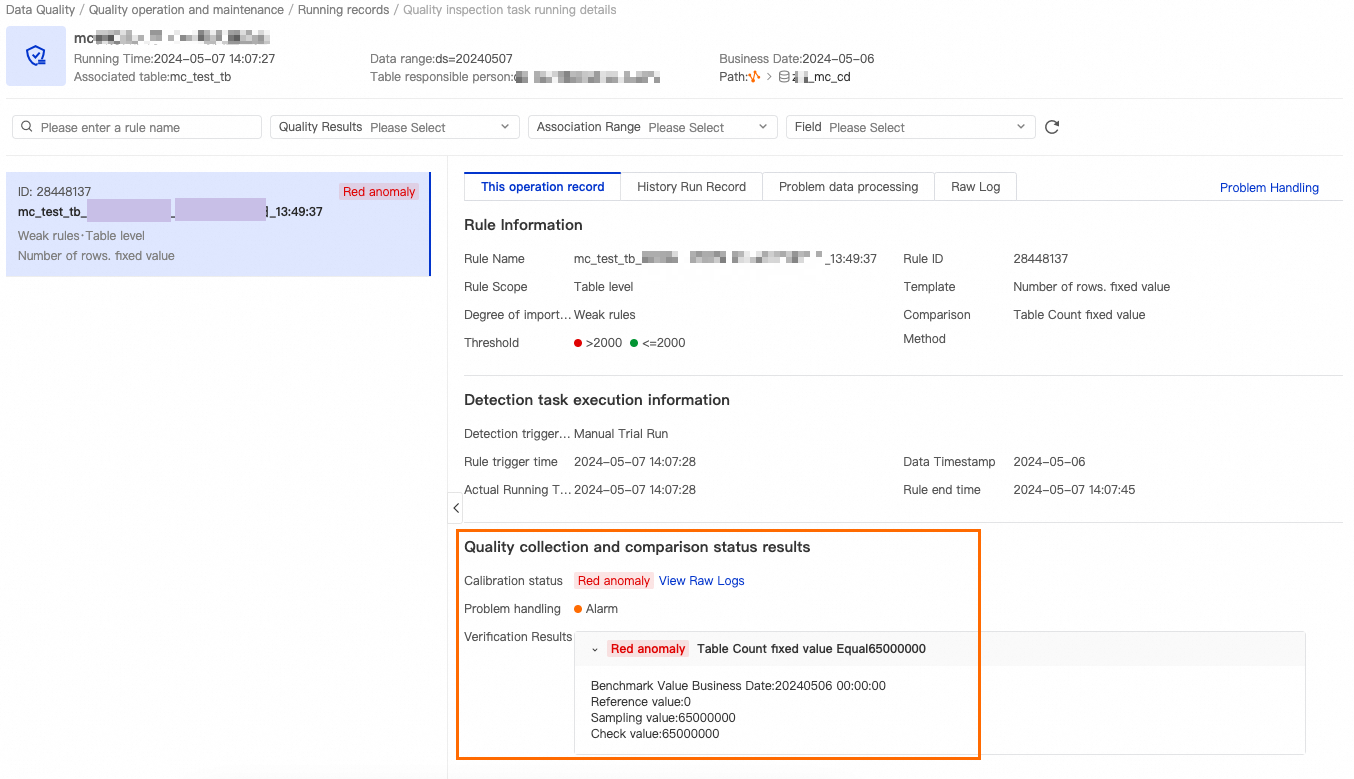
After the Startup successful message appears, click View Details to see the test results. In this example, the MaxCompute test table contains more than 2,000 rows, so the quality check result is abnormal and highlighted in red.
-
Once you confirm the rule triggers correctly, update the quality monitoring task: set Trigger Method to Triggered by Node Scheduling in Production Environment. This associates the task with a specified recurring schedule task in DataWorks Operation Center — the quality rules then run automatically each time the associated node finishes.
Step 6: Subscribe to quality monitoring alerts
Set up alert subscriptions so the right people are notified when a rule violation occurs.
-
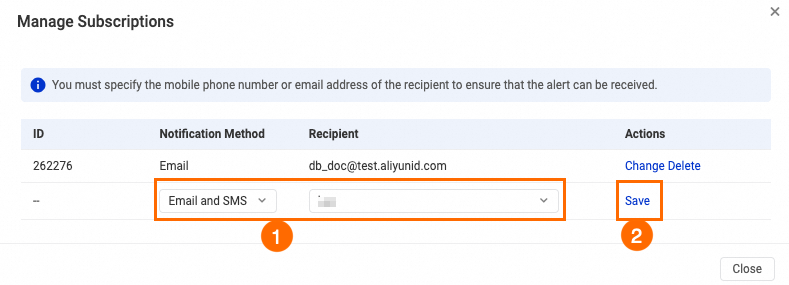
On the Monitor tab of the Table Quality Details page, find the quality monitoring task. In the Actions column, click More > Alert Subscription.
-
Configure the Notification Method and Authorization Object, then click Save.
Next steps
-
To configure quality monitoring rules and tasks for a single table in detail, see Configure rules for a single table.
-
To configure monitoring rules across multiple tables at once, see Configure rules from a template (batch configuration).
-
To review the results of a quality monitoring run, see View quality monitoring execution details.