Tasks in DataWorks move through a lifecycle: scheduled → queued → running → complete. When a task reaches Waiting For Resources, it has been submitted to the scheduler but is waiting for an available slot in a resource group before it can run.
Why do tasks wait for resources?
Resource groups have a fixed concurrency limit. If enough tasks are already running and none have finished, new tasks queue up. This applies to three resource types:
-
Scheduling resource groups (handle task dispatch)
-
Data Integration resource groups (run sync tasks)
-
Engine computing resources (run compute tasks)
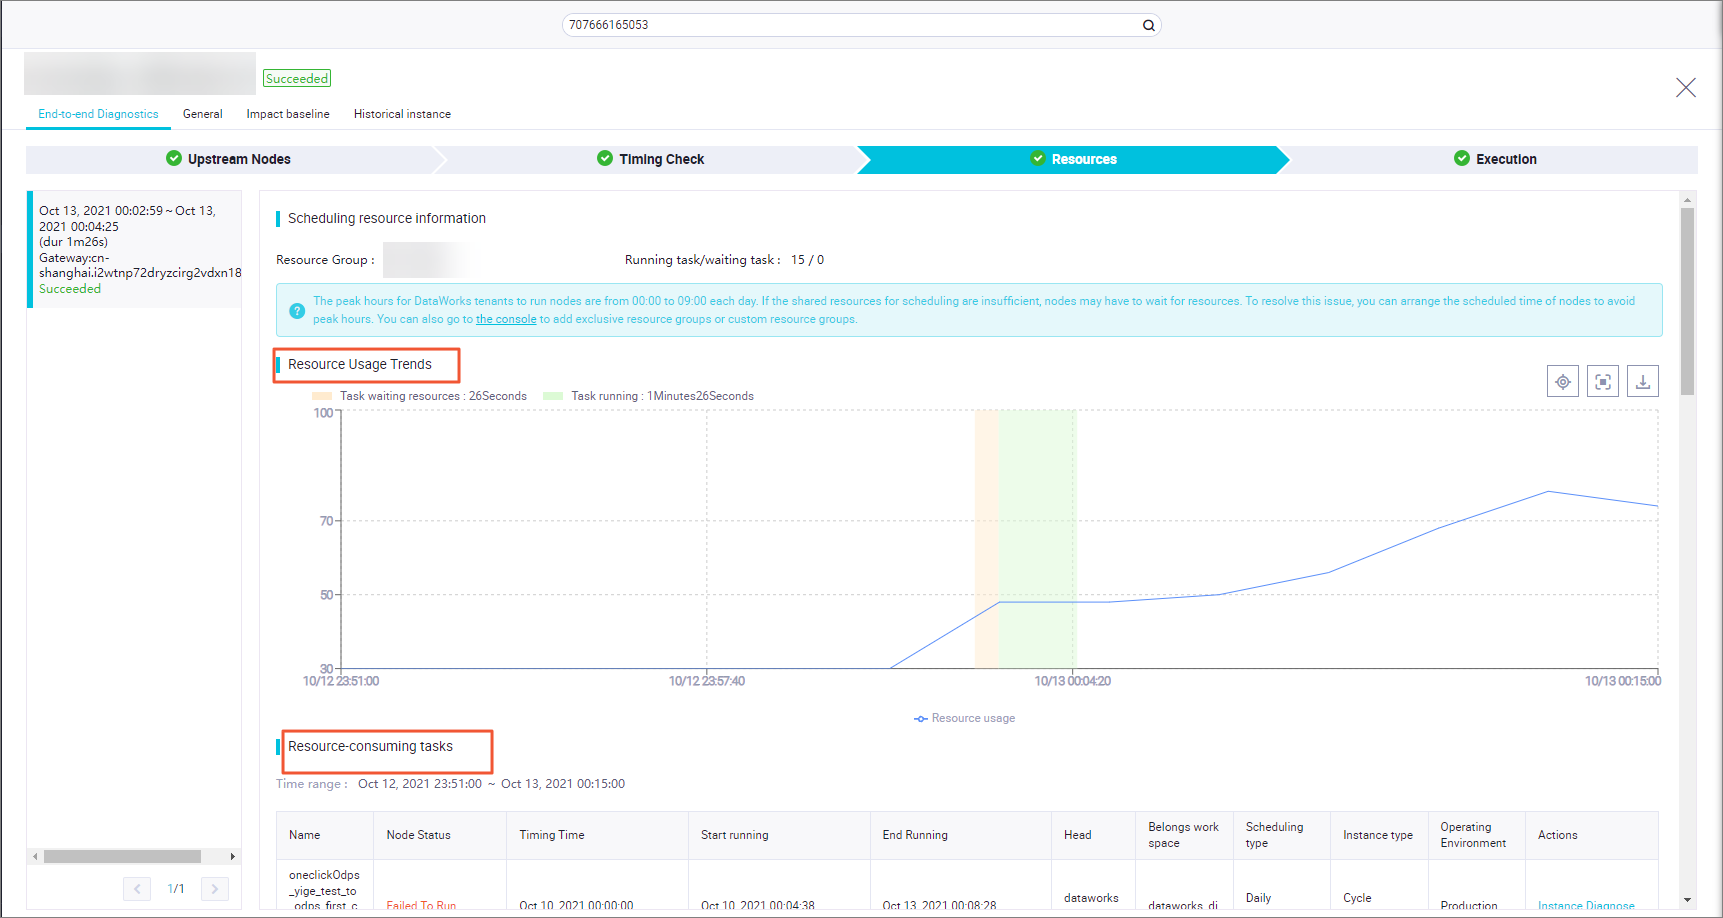
To identify which tasks are holding resources, go to Operation Center > Smart Diagnosis and enter the instance ID. Smart Diagnosis shows the execution and queuing status of the task and identifies which other tasks are occupying resources. Once you know what's blocking, decide whether to wait, stop a long-running task, or scale out the resource group.
To run diagnostics directly from Operation Center: right-click the instance node in the Waiting For Resources state and select Run Diagnostics > Schedule Resource.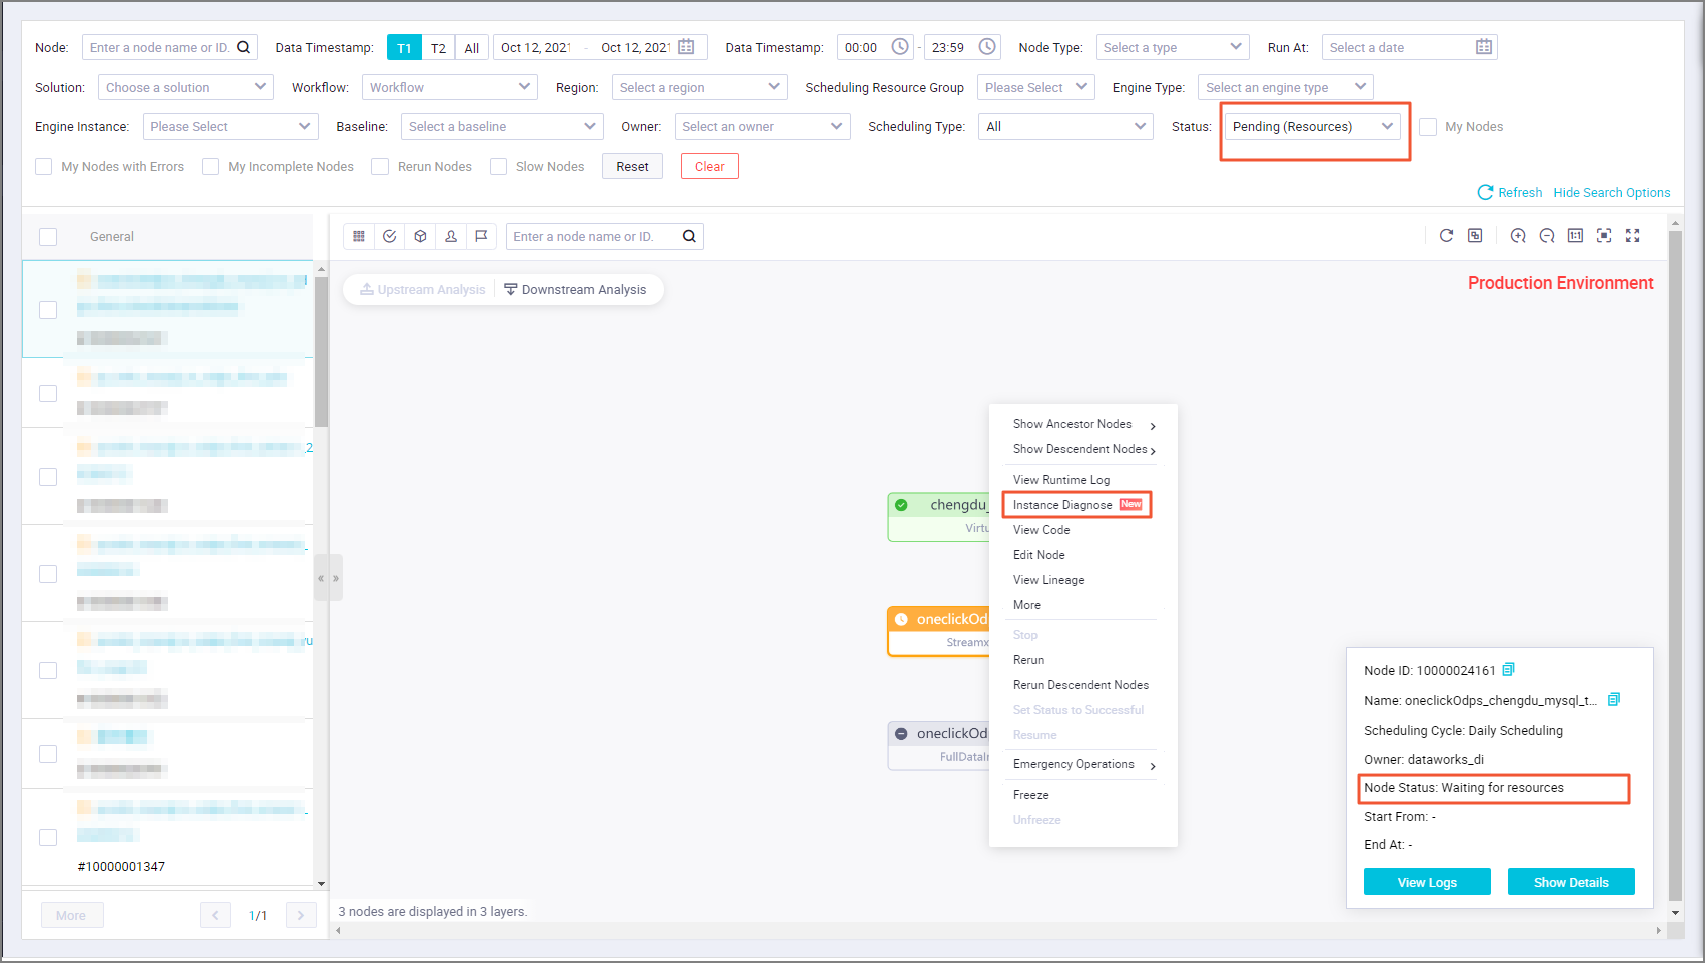
For background on how task dispatching works, see DataWorks resource groups.
Why does a task keep waiting for gateway scheduling resources?
The task log indicates it is waiting for gateway scheduling resources when the number of concurrent tasks in the resource group has hit its limit.
Your options: wait for running tasks to release resources, or scale out the exclusive resource group for scheduling. To see what is currently running and consuming capacity, use one of the following methods based on your resource group type.
If you are on a shared resource group for scheduling
-
Smart Diagnosis — Go to Operation Center > Smart Diagnosis and enter the instance ID. Smart Diagnosis identifies which tasks are holding slots and how long they have been running. To check inline, right-click the instance node in the Waiting For Resources state and select Run Diagnostics > Schedule Resource.
-
O&M Dashboard — In Operation Center, open O&M Dashboard to see public resource group usage.
Peak usage for DataWorks tasks is 00:00–09:00 daily. During this window, public scheduling resources are under heavy demand. To reduce contention, schedule tasks outside peak hours or add an exclusive resource group for scheduling in the DataWorks console.
If you are on an exclusive resource group for scheduling
-
Smart Diagnosis — Go to Operation Center > Smart Diagnosis and enter the instance ID. Review the queuing details to see which tasks are holding resources.
-
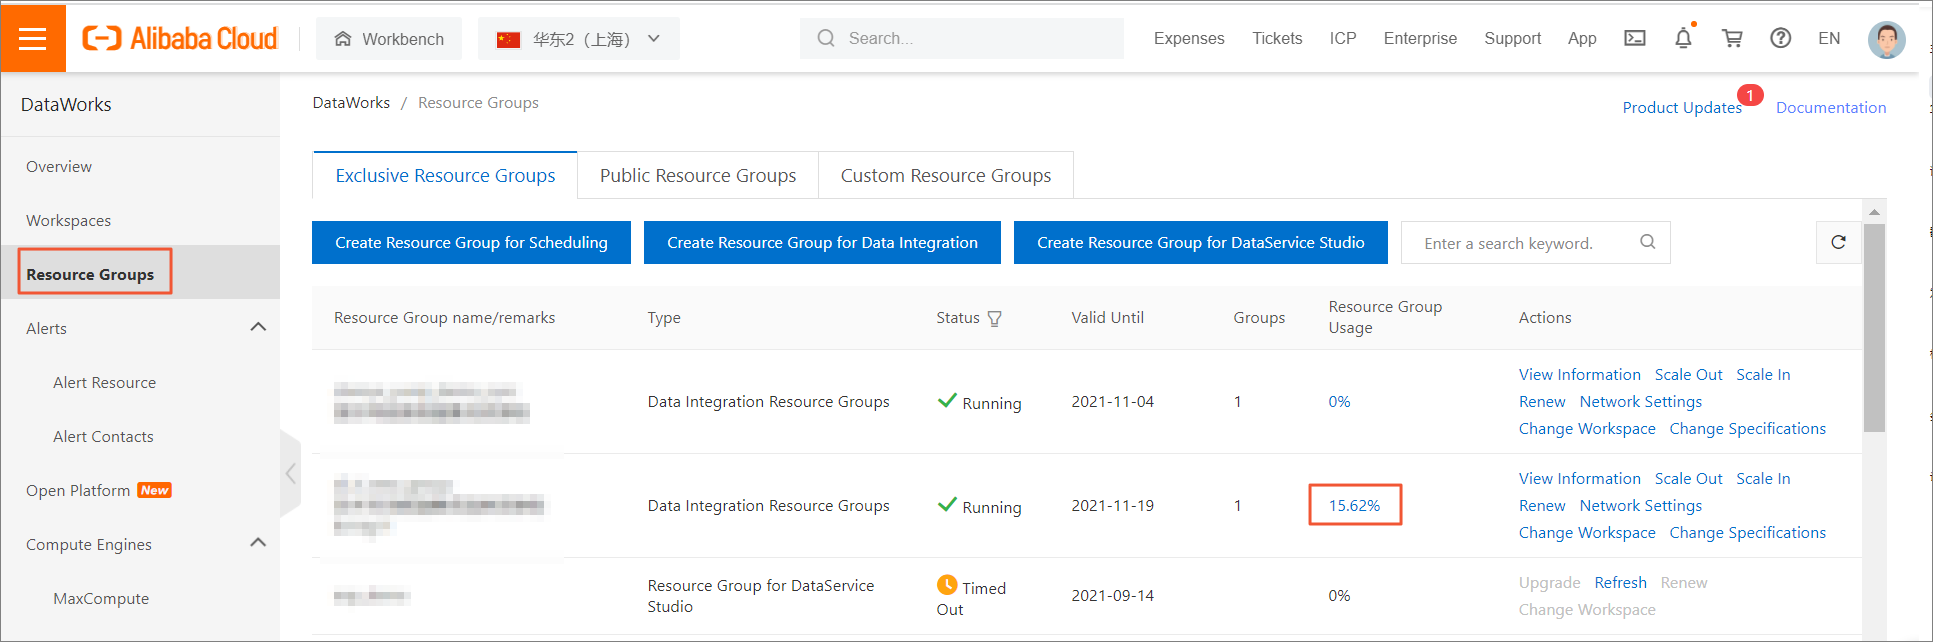
DataWorks console — In the DataWorks console, click Resource Group List in the navigation pane. Check the Usage column, then click the usage value to see Resource Group Information and Resource Usage details.
-
Resource O&M — In Operation Center, click Resource O&M in the left navigation pane to view resource utilization.
Exclusive resource groups for scheduling support different maximum concurrent instances depending on their specification. For details, see Billing of subscription exclusive resource groups for scheduling.
Why does a data integration task always show a "wait" status?
When a data integration task log shows a wait status, the resource group's concurrency limit has been reached — too many tasks are running simultaneously.
If resource usage appears high but no tasks are actively running, or tasks cannot start even though the running count is below the limit, contact support.
Start by checking the concurrent parameter in the log or task configuration. If it is set too high relative to what the resource group supports and the number of tasks currently running, lower it. If a single task's concurrency exceeds the resource group maximum, stop all concurrent tasks, adjust the setting, and rerun.
To see which tasks are running, go to Operation Center > O&M Dashboard, select the Data integration tab, and review the Sync Task Execution Details section.
Keep these constraints in mind when configuring concurrency:
-
Stay within the maximum concurrent connections supported by the resource group
-
Account for the data volume across all concurrently running tasks and the concurrency settings of each individual task
-
Each data integration task occupies one scheduling resource — a task that runs long can block others
If adjusting concurrency is not enough, wait for running tasks to finish or scale out the exclusive resource group for Data Integration. To check current resource capacity:
-
Smart Diagnosis — Go to Operation Center > Smart Diagnosis and enter the instance ID. Review the queuing details and identify which tasks are holding resources.
-
DataWorks console — In the DataWorks console, click Resource Groups > Resource Group List in the navigation pane. Check the Usage value and click it to see Resource Group Information and Resource Usage.
-
Resource O&M — In Operation Center, click Resource O&M in the left navigation pane to view resource usage and running tasks.
Exclusive resource groups for Data Integration support different maximum concurrent instances depending on their specification. For details, see Billing of subscription exclusive resource groups for Data Integration.
For speed and throughput issues with offline sync tasks, see Accelerate or limit the speed of offline sync tasks.