After you configure a task, you can manage it and view its run metrics. This topic describes common management operations for full and incremental synchronization tasks.
Manage full and incremental synchronization tasks
After you configure a synchronization task, you can view a list of your tasks on the page. You can filter the tasks based on different criteria and perform the following operations:
Operation | Description |
Start | In the Operation column, click Commit and Run to start the synchronization task. |
Edit | As business requirements change, you can add or remove tables from full and incremental synchronization tasks. In the Operation column, click to open the configuration page where you can add or remove tables. After you finish, click Commit and Run. When you commit the task, the system compares the current table list with the one from the last successful run. If the system detects new tables, it adds them to the synchronization process. For more information, see Add or remove source tables to or from a synchronization solution that is running. If you use one-click real-time synchronization, new tables first require a Full Initialization. After the initialization is complete, the system adds the tables to the Real-time Data Synchronization task and starts it.
Note When the Real-time Data Synchronization task resets its start position and runs, it appends change data for the new table. The task's start time is reset to when the Full Initialization of the new table began. For example, a synchronization task starts at 8:00 and is still running at 9:00. At 9:00, a new table is added. The Full Initialization for this new table starts at 9:00 and takes one hour, finishing at 10:00. The running Real-time Data Synchronization task then stops, resets its start position to 9:00, and begins appending incremental data. This process re-synchronizes all incremental data changes for all tables between 9:00 and 10:00 to the target Hologres table. This process ensures eventual data consistency. If you need to initialize all tables, use the Rerun feature.
|
Rerun | In special cases, such as corrupted source data or data link issues, you can force a full and incremental initialization for all source tables. In the Operation column, click . This operation re-migrates the source data to the target tables to quickly restore data integrity. Common scenarios that require a rerun to restore data for an entire database include: The real-time task has failed for an extended period, causing the Binary Log to be purged and preventing incremental data recovery. New columns are missing from the target table for various reasons. Data in the target table is missing or incorrect for various reasons.
Important A forced rerun synchronizes columns from the source table to the target table. If the target table is missing source columns, the process adds them. Before you rerun the task, check for potential conflicts with running or scheduled Incremental Merge task instances. If they run concurrently with the same Business Date, they may overwrite data in partitions or tables. You can check the status of the Incremental Merge task instance on the View auto triggered instances page in the DataWorks Operation Center. If a conflict occurs, you can do one of the following: Pause the rerun operation and wait for the Incremental Merge task to complete before retrying. Freeze the upcoming Incremental Merge instance. After the rerun succeeds, resume the instance.
After the rerun is complete, if the system does not generate the next day's data or the Incremental Merge task does not resume automatically, you must manually check and resume the Incremental Merge instance:
|
Full Data Backfill | Use this feature when data in a MaxCompute target table is missing or incorrect, and you need to perform a full data resynchronization to backfill the data.
Note Full Data Backfill is available only for full and incremental tasks that synchronize an entire database. Full Data Backfill is not available for synchronization tasks that use database and table sharding.
In the Operation column, click Backfill all data and configure the parameters: Select the Business Date for the data backfill. For a partitioned table, the process synchronizes the full data to the date partition corresponding to the specified Business Date. Select the target tables for the backfill. In the selection box on the left, choose the tables for the full synchronization, and then click the  icon to move them to the right. icon to move them to the right. Click OK to start the Full Data Backfill operation.
Important You can only select a single Business Date at a time. To backfill data for multiple days, you must run the Full Data Backfill operation multiple times. The process copies the common columns between the source and target tables, as well as any additional columns defined in the full and incremental synchronization task. Before you start a Full Data Backfill, check if the specified Business Date could conflict with a running or scheduled Incremental Merge task instance. If they run concurrently with the same Business Date, they may overwrite data in partitions or tables. You can check the status of the Incremental Merge task instance on the View auto triggered instances page in the DataWorks Operation Center. If a conflict occurs, you can do one of the following: Pause the Full Data Backfill operation and wait for the Incremental Merge task to complete before retrying. Freeze the upcoming Incremental Merge instance. After the Full Data Backfill is complete, resume the instance.
|
Stop | For a running task, you can click Stop in the Operation column to stop it. |
View task execution details
Click a task name to view its execution details.
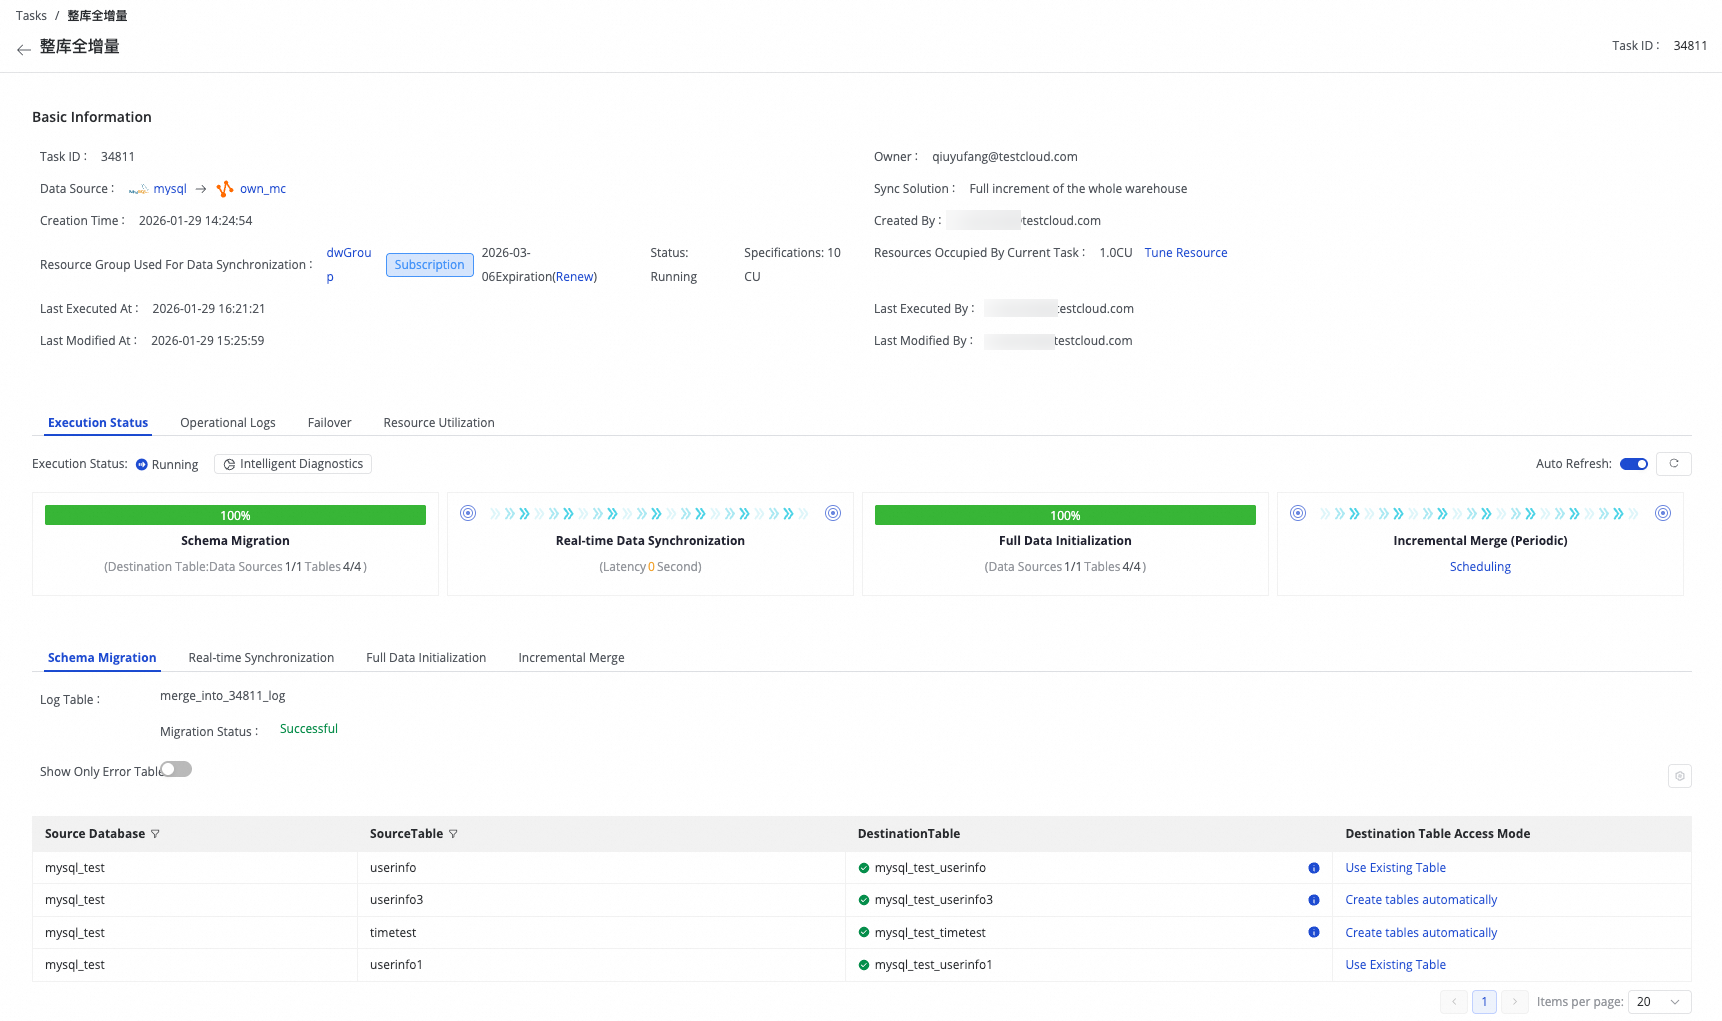
On the task list page, you can view the basic information and current run status of each task.
The task execution status includes four stages: Schema Migration, Full Initialization, Real-time Data Synchronization, and Incremental Merge. You can use the progress bar to view the current stage and the execution details of the subtasks generated in each stage.
The Incremental Merge task is a Scheduled Task. You can click its name to navigate to the Operation Center and view the corresponding Periodic Instance.