This topic provides answers to some frequently asked questions about nodes that are not run.
What are the conditions that are required for a node to successfully run?
Why is an auto triggered instance not run after its scheduling time arrives?
Precautions
Only nodes in Operation Center in the production environment can be automatically scheduled. You must make sure that your nodes are deployed to Operation Center in the production environment. For more information about how to deploy a node, see Publish tasks.
What are the conditions that are required for a node to successfully run?
In Operation Center, auto triggered instances that are in different states are marked in different colors.
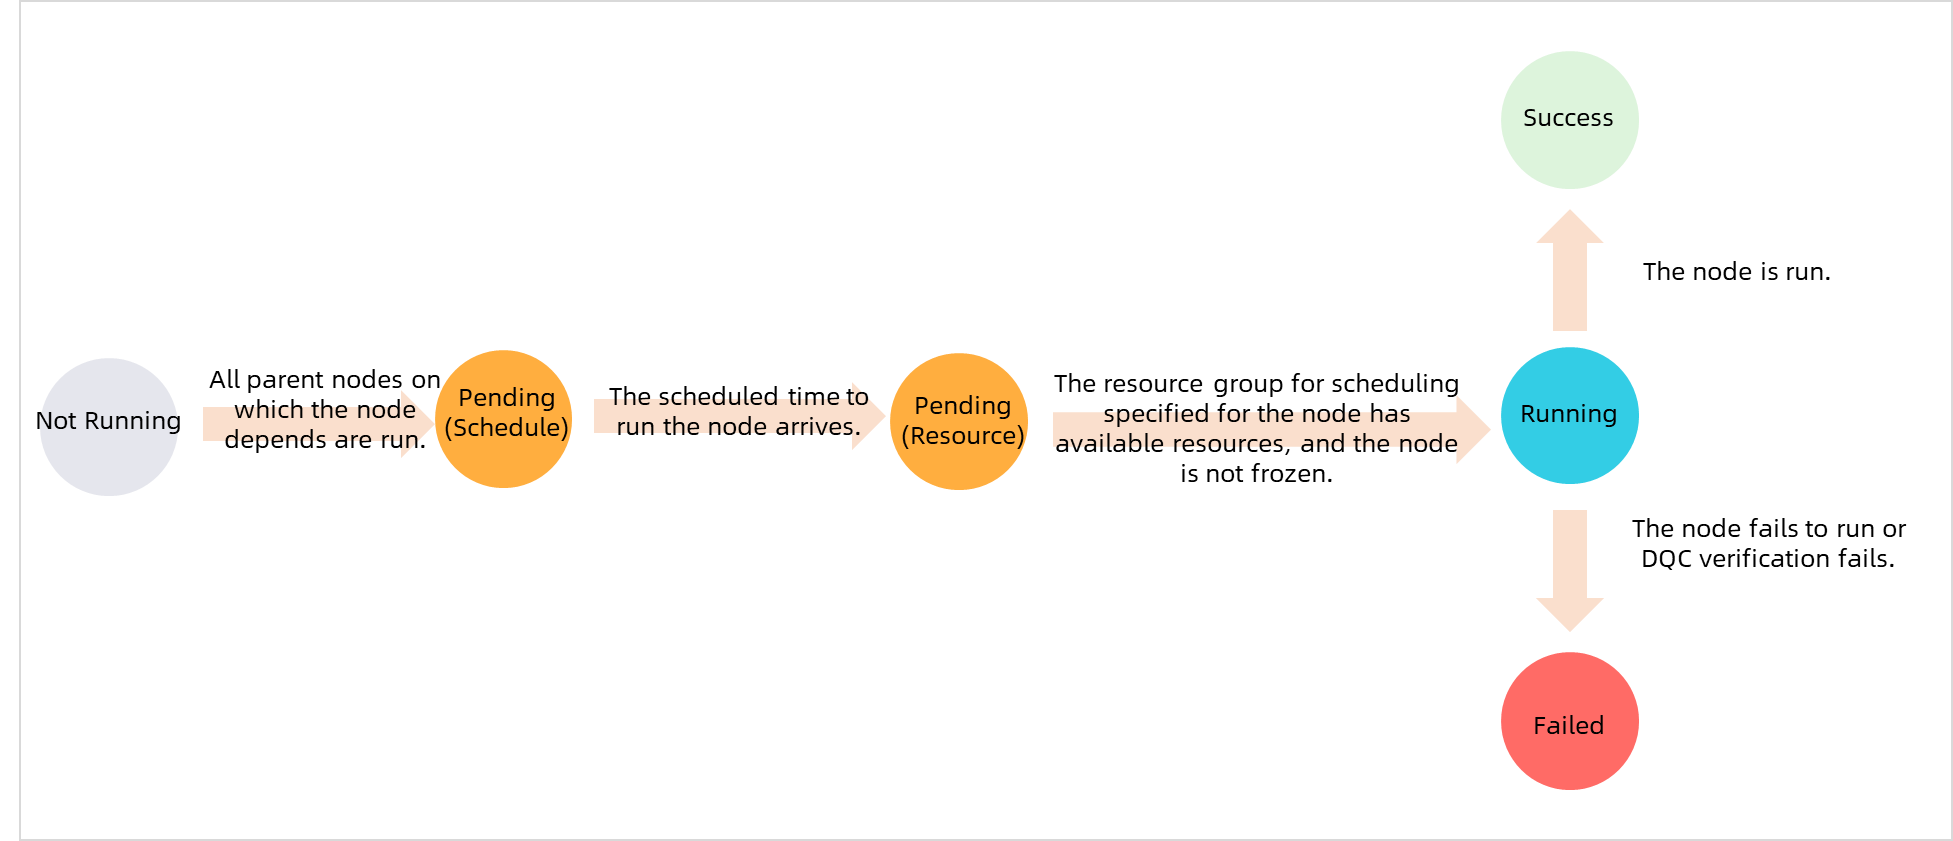
To ensure that a node can be scheduled as expected, the following conditions must be met: The scheduling resources for the node are sufficient. The scheduling time of the node has arrived. The ancestor nodes of the node are successfully run. The node is not frozen.
|
No. |
Status |
Icon |
Flowchart |
|
1 |
Run Successfully |
|
|
|
2 |
Not run |
|
|
|
3 |
Failed To Run |
|
|
|
4 |
Running |
|
|
|
5 |
Wait time |
|
|
|
6 |
Freeze |
|


If an auto triggered instance is marked in purple, the instance is frozen. The node that generates the instance is not run and descendant nodes of the node are blocked from running. To view operation records of the instance, go to the Cycle Instance page in Operation Center, click Show Details in the directed acyclic graph (DAG) of the instance, and then click Operation Log tab.
If an auto triggered instance is marked in yellow, the scheduling time of the instance has not arrived. To view the information about the instance, go to the Cycle Instance page in Operation Center, click Show Details in the DAG of the instance, and then click General tab.
NoteIf the instance is in the Waiting for resources state, the number of nodes that are run on the current resource group in the current workspace has reached the upper limit. You can right-click the instance in the DAG on the Cycle Instance page, and select Instance Diagnose. In the Resources step, you can view the nodes that occupy the resources in the current resource group. For more information about resource waiting, see Waiting for resources.
If the instance is in the Waiting time state, the scheduling time of the instance has not arrived.
If an auto triggered instance is marked in gray, the instance is not run as expected. You can right-click an instance that is marked in gray in the DAG on the Cycle Instance page and select Show Ancestor Nodes to view the status of the ancestor nodes of the node that generates the instance. We recommend that you use the intelligent diagnosis and ancestor node analysis features to view the status of the ancestor nodes of the node that generates the instance.
If an auto triggered instance is marked in blue, the instance is running. If the instance is in the running state for a long period of time, the scheduling resources may be insufficient. For more information about why an instance waits for resources, see Waiting for resources.
NoteIf the ancestor nodes of the node that generates the instance are not in the preceding states and all nodes in the workflow to which the node belongs are marked in gray, the dependency between the node and its ancestor nodes is changed and the workflow is isolated. For more information, see Scenario: Isolated node.
Why is an auto triggered instance not run after its scheduling time arrives?
Problem description
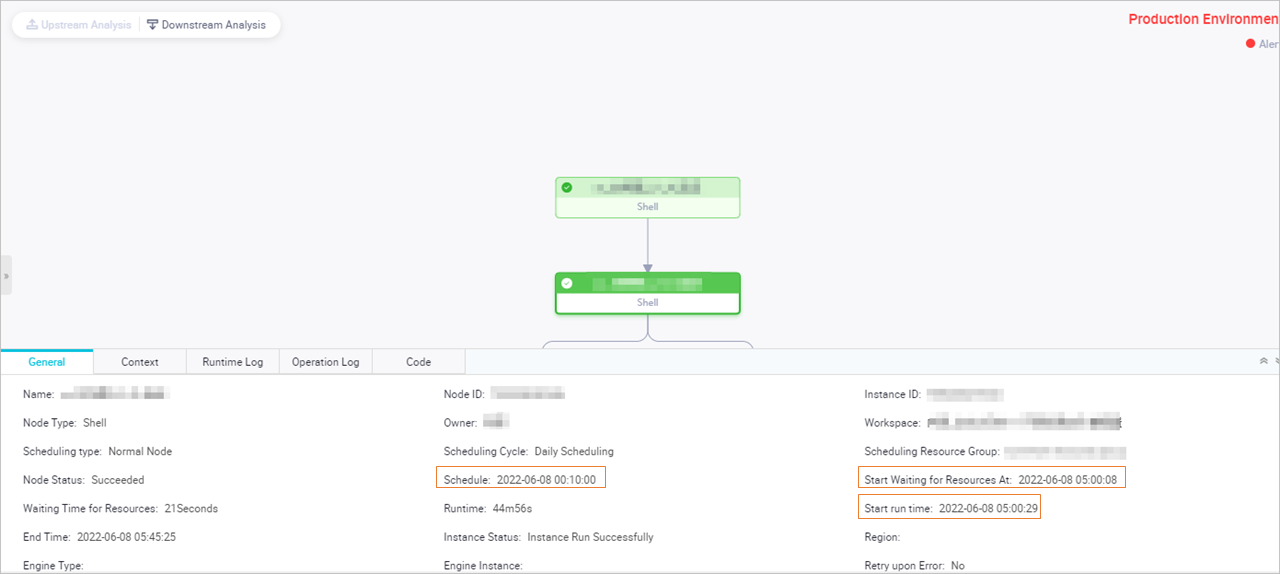
For an auto triggered instance, the scheduling time and the time at which the instance starts to run may be different. For example, the instance may not start to run after its scheduling time arrives.
Troubleshooting
You can use the ancestor node analysis feature to identify the instance that blocks the current instance from running. Then, you can use the intelligent diagnosis feature to quickly identify the cause of the issue.
The following scenarios show the reasons why an auto triggered instance in DataWorks is not run as expected. In the following figures, a three-layer dependency is used. A dependency of more than three layers may exist in actual scenarios. The dependency logic is the same regardless of the number of layers.
Scenario 1: The ancestor nodes of the auto triggered node that generates the current instance are not successfully run. The instance is in the Not running state and is marked in gray.
Example: The current time is 01:00. Instance A2 is scheduled to run at 01:00, Instance A3 is scheduled to run at 03:00, and Instance B is scheduled to run at 00:00. Instance B depends on Instance A2 and Instance A3.
Analysis: The scheduling time of Instance B is 00:00 and has arrived. However, the scheduling time of Instance A2 and Instance A3 has not arrived. In this case, Instance B can start to run only after Instance A2 and Instance A3 are successfully run. If Instance A2 or Instance A3 fails to run, Instance B cannot be run as expected. In this case, Instance B enters the Not running state.
Conclusion: The current instance can start to run only after its ancestor instances are successfully run.
NoteIf the ancestor instances of the current instance are in the running state for a long period of time, you can use one of the following methods to fix the issue:
If the ancestor instances are generated by non-batch synchronization nodes, you can perform the following operations to view the cause.
If the ancestor instances are generated by batch synchronization nodes, one possible cause is that the ancestor instances are in the state of waiting for resources for a long period of time. Another possible cause is that the speed at which the logic of some code is processed is slow during the node running. For more information, see How to troubleshoot the issue that the execution duration of a batch synchronization node is long?
Scenario 2: The scheduling time of an auto triggered node that generates the current instance has not arrived. The instance is in the Waiting time state and is marked in yellow.
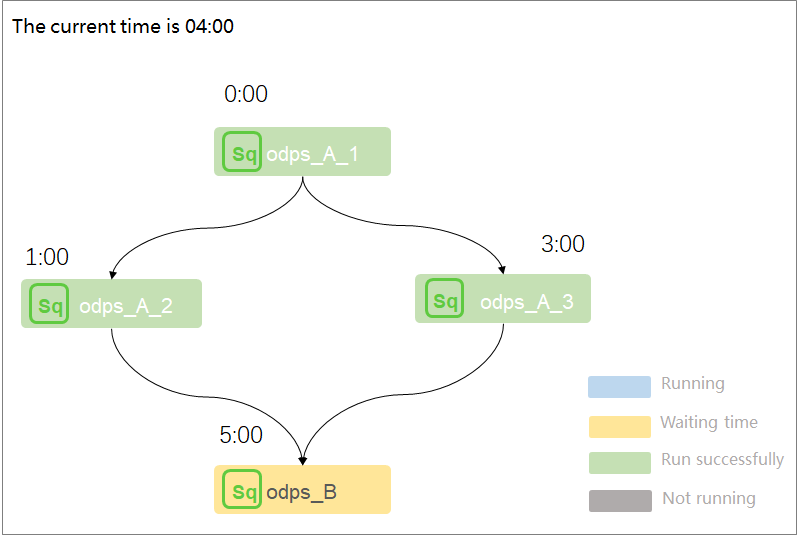
Example: The current time is 04:00. Instance A2 is scheduled to run at 01:00, Instance A3 is scheduled to run at 03:00, and Instance B is scheduled to run at 05:00. Instance B depends on Instance A2 and Instance A3.
Analysis: Instance A2 and Instance A3 are successfully run before the scheduling time of Instance B arrives. In this case, Instance B is in the Waiting time state before its scheduling time arrives.
Conclusion: The current instance can be run after its scheduling time arrives.
Scenario 3: Scheduling resources in the current workspace are not sufficient. Therefore, the current auto triggered node instance cannot be run. The instance is in the Waiting for resources state and is marked in yellow.
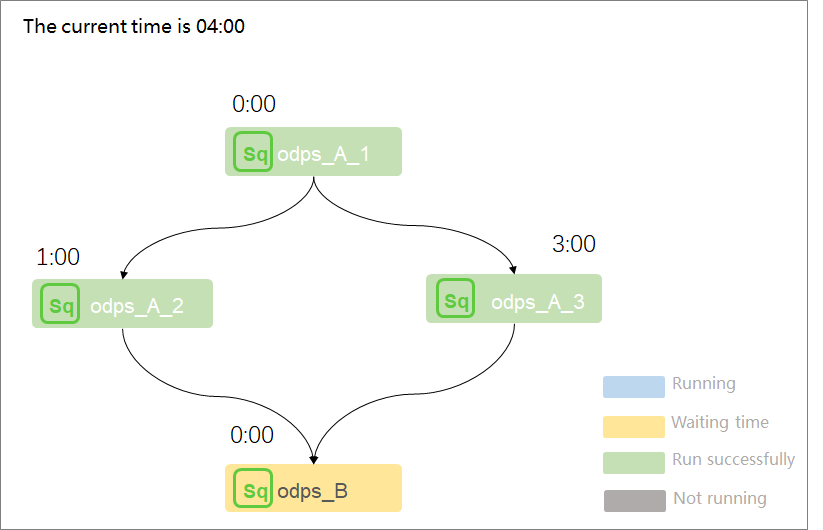
Example: The current time is 04:00. Instance A2 is scheduled to run at 01:00, Instance A3 is scheduled to run at 03:00, and Instance B is scheduled to run at 00:00. Instance B depends on instances A2 and A3.
Analysis: Instance A2 and Instance A3 are successfully run before the scheduling time of Instance B arrives. However, the scheduling resources in the resource group for scheduling that is used to run Instance B are insufficient. As a result, the status of Instance B is Waiting for resources.
Conclusion: The current instance can be run only when the scheduling resources in the current workspace are sufficient. If an instance is waiting for resources, the log information shows that the number of nodes that are run on the current resource group in the current workspace has reached the upper limit, and the instance is waiting for gateway resources.
NoteIf Instance B is run on an exclusive resource group for scheduling and you want to view the resource usage of the resource group, you can use one of the following methods: 1. Log on to the DataWorks console, and click Resource Groups in the left-side navigation pane. On the Resource Groups page, view the nodes that are run on the exclusive resource group for scheduling and view the usage of the resource group. 2. Right-click Instance B in the DAG and select Instance Diagnose to check the nodes that occupy resources in the exclusive resource group for scheduling. For more information, see Waiting for resources.
Scenario 4: The current instance is frozen. The instance is in the Frozen state and is marked in purple.
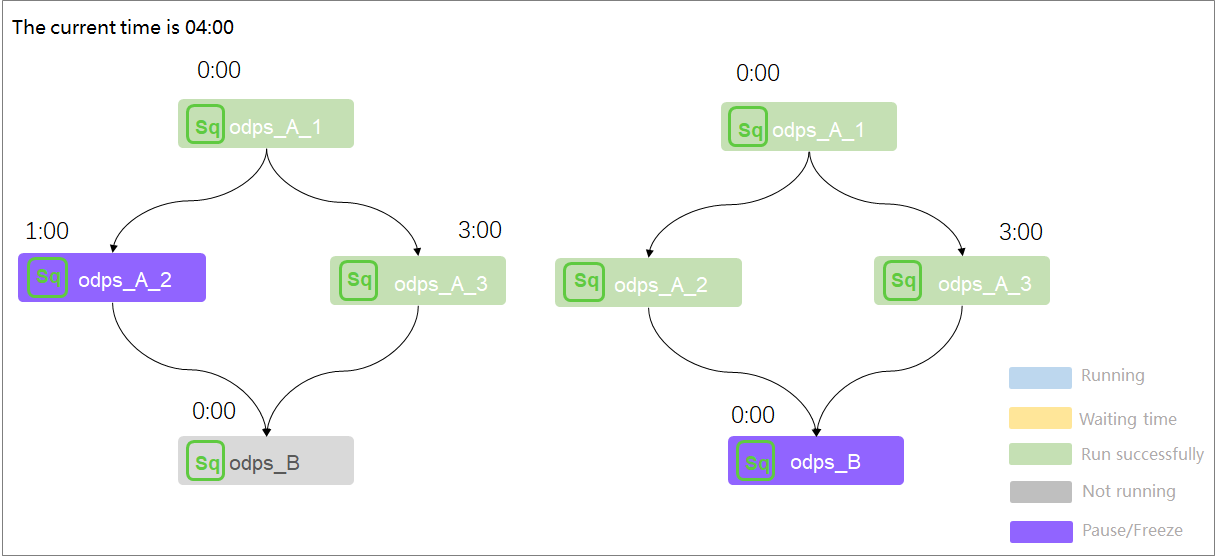
Example: The current time is 04:00. Instance A2 is scheduled to run at 01:00 and is in the suspended state, Instance A3 is scheduled to run at 03:00, and Instance B is scheduled to run at 00:00. Instance B depends on instances A2 and A3.
Analysis: Scenario 1 shows that an instance can start to run only after all of its ancestor instances are successfully run. The DAG on the left in the preceding figure shows that Instance A2 is frozen. As a result, Instance B cannot be run. The DAG on the right in the preceding figure shows that all the ancestor instances of Instance B are successfully run. However, Instance B cannot be run as scheduled because Instance B is frozen.
Conclusion: If the current instance is frozen or the ancestor instances of the current instance are frozen, the current instance cannot be run as scheduled.