The Directed Acyclic Graph (DAG) in Operation Center displays the dependencies between your nodes. The DAG also supports features such as node aggregation and upstream/downstream analysis to improve operations and maintenance (O&M) efficiency. This topic describes the features of the DAG.
Limits
Only users of DataWorks Professional Edition or a higher edition can use the node aggregation, upstream analysis, and downstream analysis features of the DAG. For more information about how to upgrade your edition, see Software edition selection and billing.
DAG graph features
Click DAG Graph next to a node to open its DAG. You can perform the following operations in the DAG. This topic uses the DAG of a recurring instance as an example: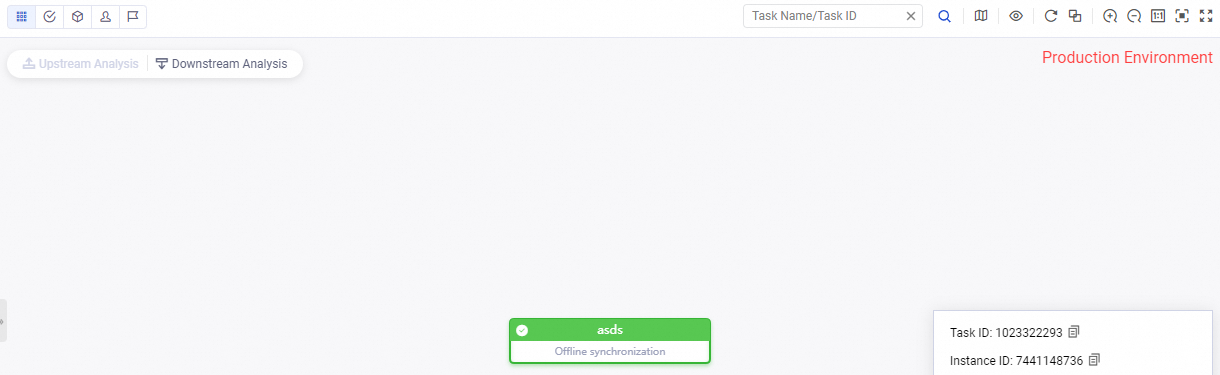
Node aggregation
If a recurring instance has too many nodes or layers, you can aggregate the nodes by dimensions such as node status, workspace, owner, or priority. This lets you view the number of nodes for a specific dimension. You can then allocate and run nodes more effectively. The following examples show how nodes are displayed when they are not aggregated and when they are aggregated by priority.
NoteYou can aggregate nodes by status only in the DAGs for instances. This includes auto-triggered recurring instances, manually-triggered data backfill instances, and test instances.
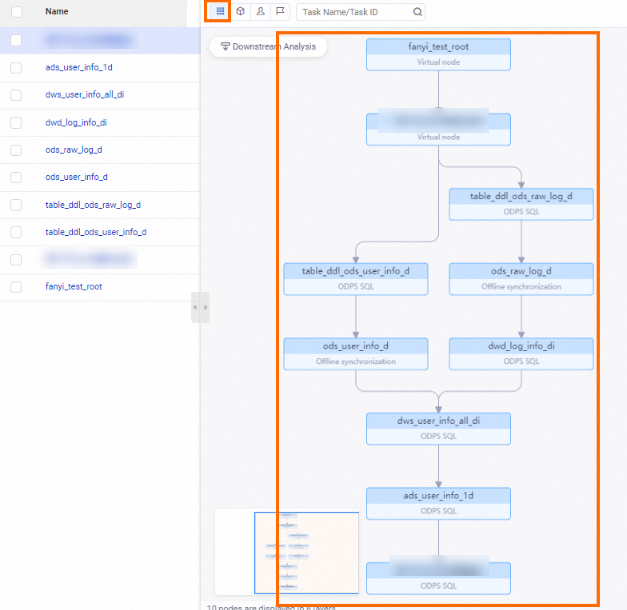
When nodes are not aggregated, the graph appears as shown in the following figure.
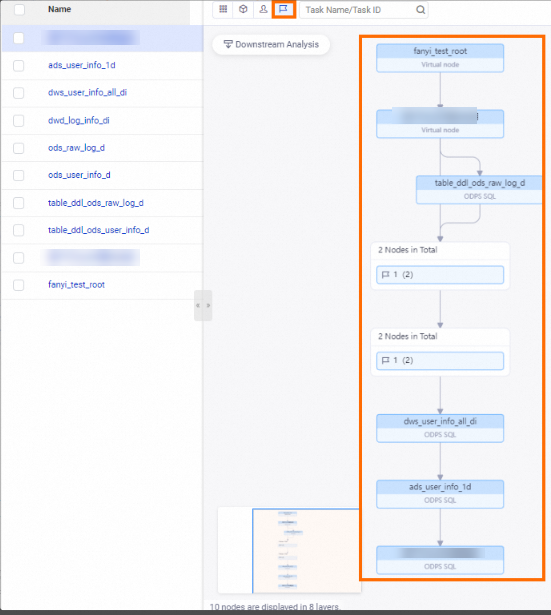
When nodes are aggregated by priority, the graph appears as shown in the following figure. You can quickly see that the current node has 6 child nodes with a priority of 1.
Upstream analysis
Recurring instances often have upstream and downstream dependencies. If a target node has not run for an extended period, you can perform an upstream analysis on it. This displays the ancestor nodes that are blocking the current node in the DAG. You can then quickly locate and resolve any runtime errors to improve node execution efficiency.
NoteUpstream analysis is supported only for the DAGs of instances. This includes auto-triggered recurring instances, manually-triggered data backfill instances, and test instances.
You can perform an Upstream Analysis only on nodes that have not run. A maximum of six layers are displayed. To display more layers, click Continue Analysis in the upper-left corner.
Upstream analysis helps you quickly find the ancestor nodes that the current node depends on but have not run successfully. These nodes may be in the running, failed, waiting for time, waiting for resource, or frozen (paused) state. Ancestor nodes in these states block descendant nodes from running.
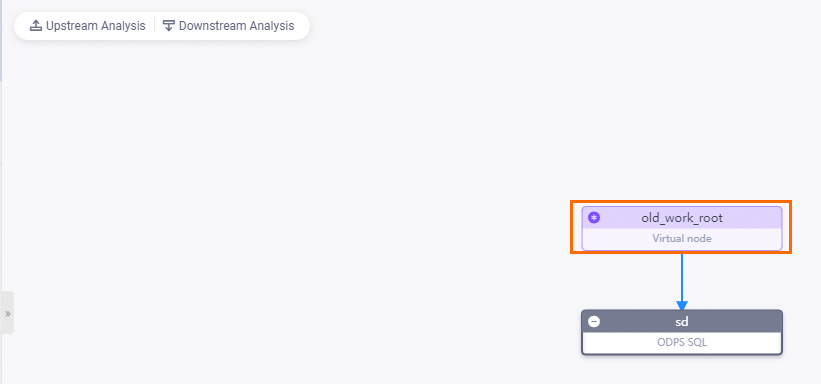
If the example node has not run for an extended period, select the node and click Upstream Analysis in the upper-left corner.
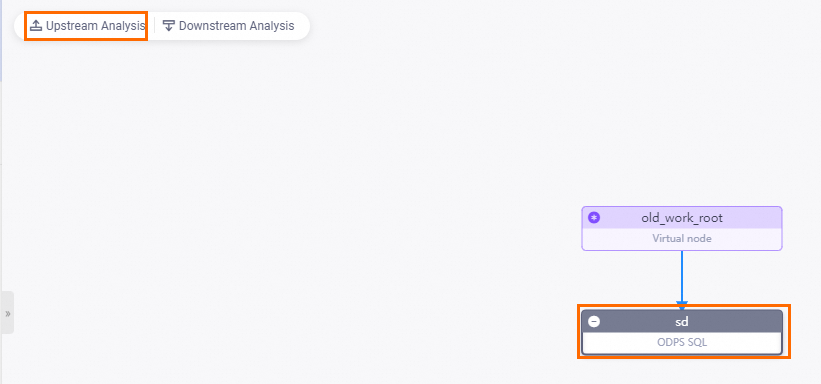 The analysis shows that the ancestor node blocking the current node is the
 old_work_rootnode, as shown in the following figure. This result helps you quickly locate the blocking node and resolve related errors.NoteWhat to do next:
After you locate the key instance, you can filter by an aggregation dimension to view the workspace or owner of the key instance that affects the data output of the current node. This helps improve your O&M efficiency.
After you locate the key instance that is blocking the current instance, you can also right-click the instance and select Run Diagnosis to quickly analyze why the instance has not run successfully. For more information, see Intelligent Diagnosis.
Downstream analysis
When you open a DAG, three layers are displayed by default. These layers include the current node, its first-level parent nodes, and its first-level child nodes. If a recurring instance has too many nodes or layers, it can be difficult to see the scope of impact. You can use the downstream analysis feature to filter by dimensions such as node status, workspace, owner, or priority. This lets you count the number of nodes in different layers or the total number of nodes across all layers for a target dimension.
NoteIn an aggregated state, you can merge or layer the display. After you click Downstream Analysis, the nodes are aggregated by owner by default, and the total number of nodes for this dimension across all layers is counted.
In a non-aggregated state, if there are more than 10 descendant nodes, they are displayed in groups by default. This view gives you a clearer understanding of the business impact of the node.
In a non-aggregated state, you can click Ungroup to view the nodes in a group individually. This view shows you the upstream and downstream relationships of all nodes.
When Downstream Analysis uses the Layered view to display results, a maximum of six layers are shown. To display more layers, click Continue Analysis in the upper-left corner.
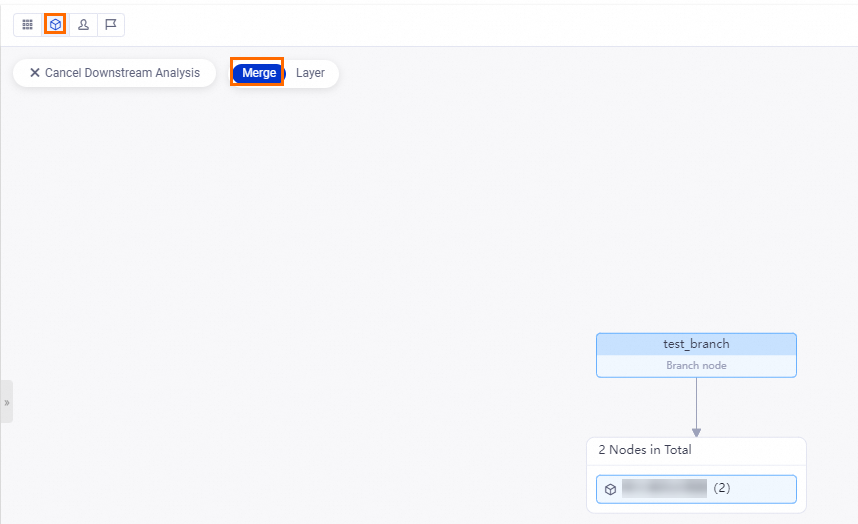
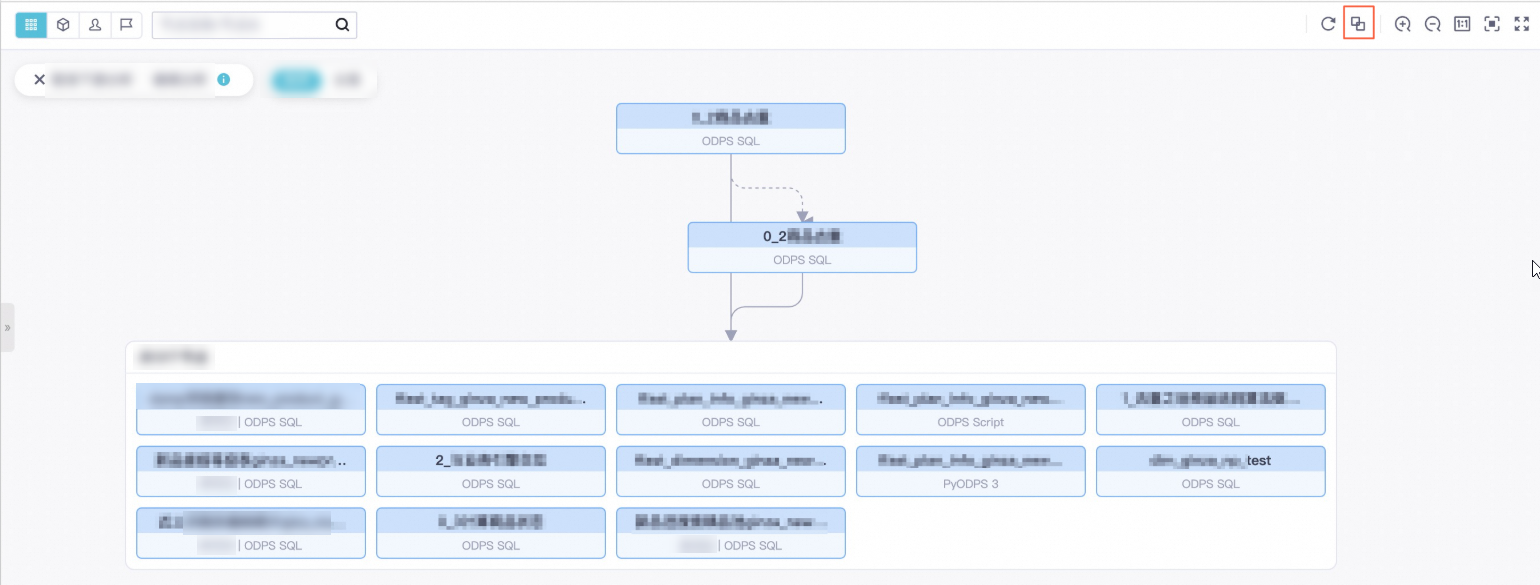
The following example shows the results of a Downstream Analysis on the tag node:
Merge: Merges the analyzed downstream nodes based on the current aggregation dimension. In a non-aggregated state, downstream nodes are displayed in groups. This example uses the Merge method and aggregates by workspace. All descendant nodes are merged into a single layer, which shows the number of nodes in different workspaces.
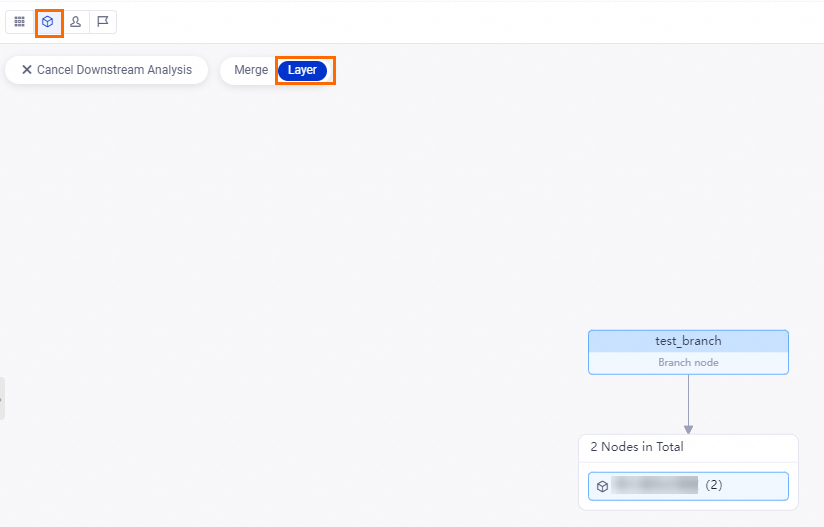
Layered: Displays the analyzed downstream nodes in layers based on the current aggregation dimension. This example uses the Layered method and aggregates by workspace. The number of nodes in different workspaces is shown in different layers.
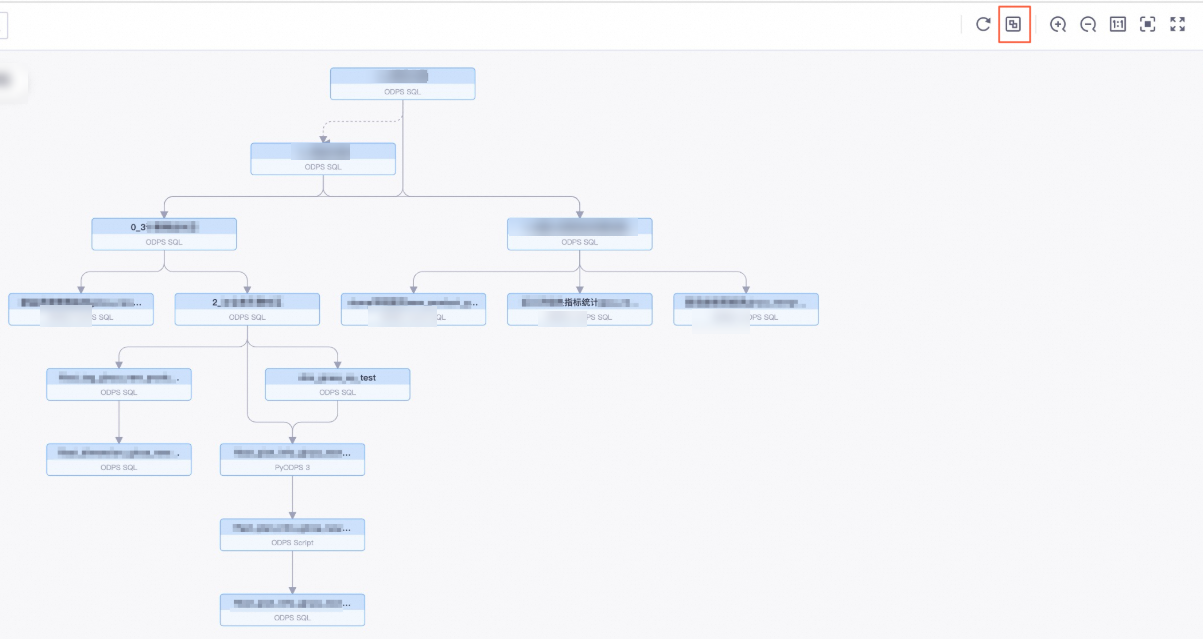
Select a display style for the DAG.
You can click the function icons in the upper-right corner of the DAG to adjust its display style. For example, you can use Full Screen or Fit to Screen.
The following example shows the DAGs for the Ungroup and Group views of a node's descendants.
The DAG for Ungroup is shown in the following figure. This view shows you the upstream and downstream relationships of all nodes.
The DAG for Group is shown in the following figure. This view displays five nodes per row in an orderly manner, which helps you quickly see the total number of descendant nodes.
The DAG shows the upstream and downstream dependencies of nodes. A solid line indicates a dependency within the same epoch, and a dashed line indicates a cross-cycle dependency. You can also right-click a target node to perform operations. The following figure uses a recurring instance as an example.
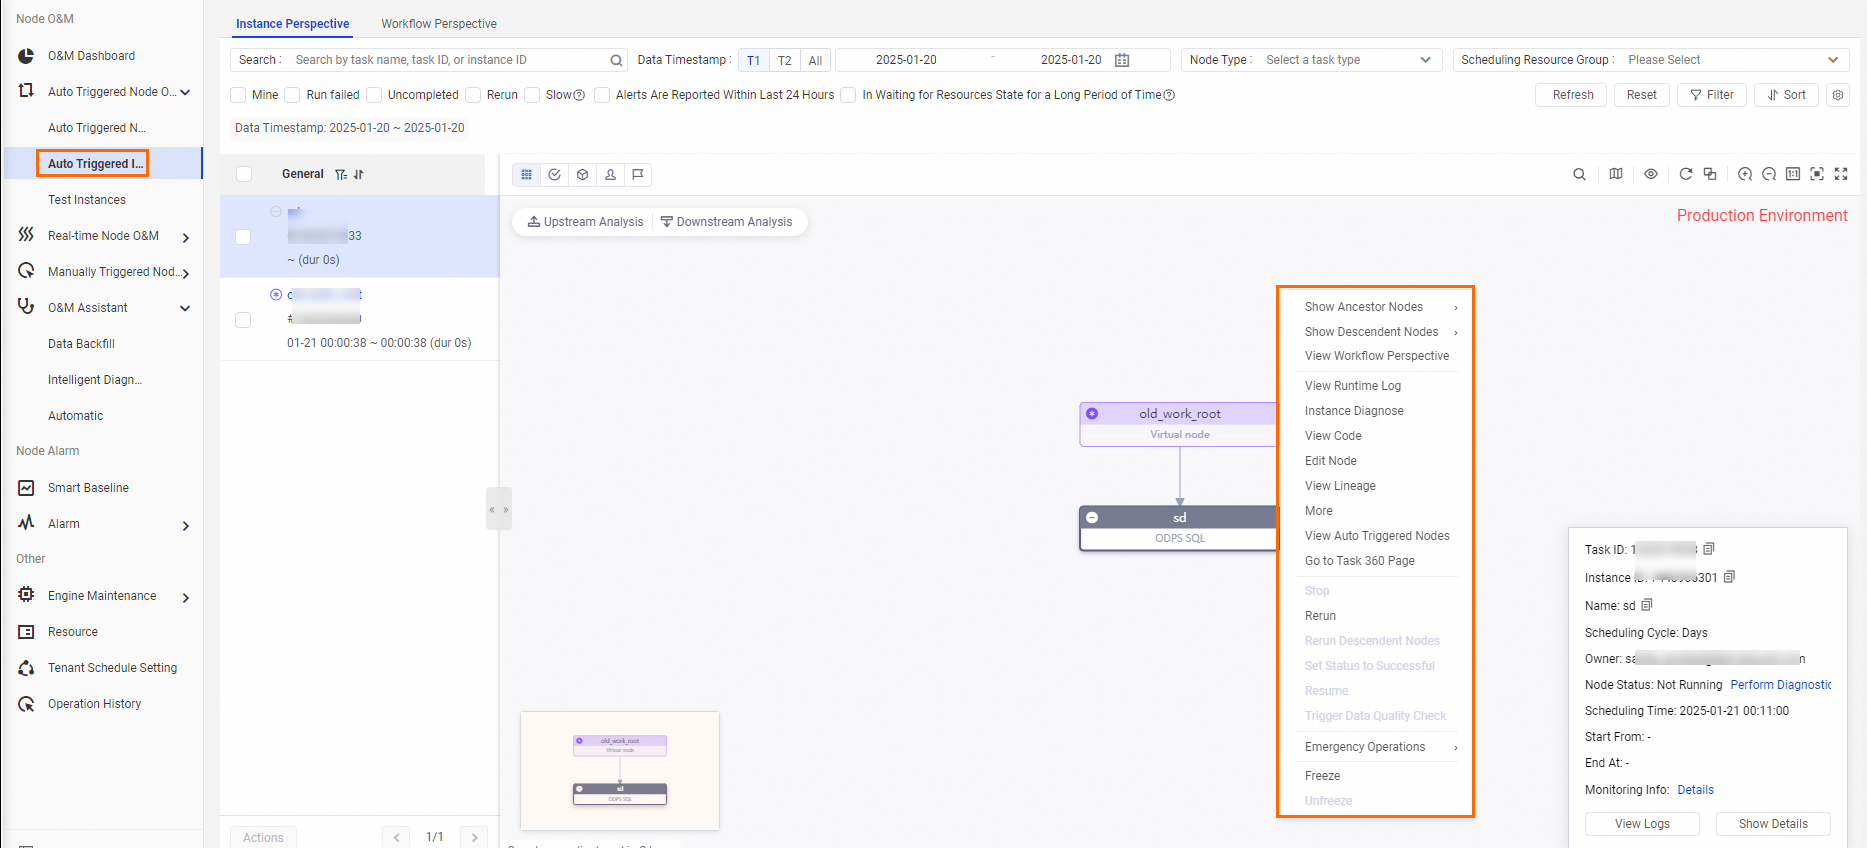
Operation
Description
Expand Parent/Child Nodes
When a business flow has three or more nodes, Operation Center automatically hides some nodes. You can expand the parent and child layers to view all nodes.
View Operational Log
View the operational log for the current instance, which can be in a running, succeeded, or failed state.
NoteInstances in shared resource groups for scheduling are retained for one month, while logs are retained for one week.
An exclusive resource group is provided for scheduling, and its instances and logs are retained for one month.
Run Diagnosis
DataWorks Operation Center provides a run diagnosis feature to help you understand the full-link information of a node's run and quickly locate issues. For more information, see Intelligent Diagnosis.
View Code
View the code of the current instance.
Edit Node
Click to go to the Data Studio page to modify the content of the current node.
View Lineage
View the lineage of the current instance.
View More Details
Click to view information about the current node, such as Properties, Context, Operational Log, Operation Logs, and Code.
Stop
You can stop only instances that are waiting to run or are running. After this operation, the instance state changes to failed.
Rerun
You can rerun a node. After the node runs successfully, it can trigger the scheduling of descendant nodes that have not run. This is often used to handle nodes that have errors or were missed.
NoteYou can rerun only nodes that are in the Not Run, Succeeded, or Failed state.
Rerun Downstream
You can rerun a node and its descendant nodes. You must select the nodes to rerun. After a selected node runs successfully, it can trigger the scheduling of its descendant nodes that have not run. This is often used for data fixing.
NoteYou can select only nodes that are in the Not Run, Completed, or Failed state. If you select a node in any other state, the page displays the message The Selected Nodes Include Nodes That Do Not Meet The Run Conditions, and you cannot submit the run.
Set to Succeeded
Changes the state of the current instance to succeeded and runs descendant nodes that have not run. This is often used to handle nodes with errors.
NoteYou can set only nodes in the Failed state to succeeded. You cannot set a business flow to succeeded.
Resume
You can resume a node after it fails. This feature is supported only for MaxCompute nodes.
NoteFor exclusive resource groups for scheduling purchased before January 2021, to upgrade, you must first click the request link to join the "Alibaba Cloud Big Data & AI Platform" communication group. Then, scan the QR code below to join the DataWorks product DingTalk group for pre-sales and after-sales consultation. You can directly at sign the intelligent robot for consultation, or contact the on-duty staff during their working hours.

Emergency Operation
An operation for the current instance in an emergency. An emergency operation is valid only for the current run of the node.
Select Remove Dependency to remove the dependency of the current node. This is often used when an ancestor node fails and has no data relationship with this instance.
Pause (Freeze)
Freezing in a recurring instance applies only to the current instance and only if it is running. A frozen recurring instance is not automatically scheduled to run (it does not actually run data) and will block its descendant nodes from running (none of the descendant nodes will be automatically scheduled).
Example scenario: If you schedule a node to run every hour, 24 instances are generated per day. If one of the hourly instances does not need to run, you can choose to freeze that instance. Freezing one hourly instance does not affect the execution of other instances.
Resume (Unfreeze)
You can unfreeze an instance that is in the frozen state.
If the instance has not run yet, it will run automatically after its ancestor nodes are complete.
If all ancestor nodes are complete, the node is directly set to failed. You must manually rerun it before it can run normally.
NoteThe unfreeze operation affects only this instance. If the auto triggered task is still frozen, the instance for the next day will also be in a frozen state.
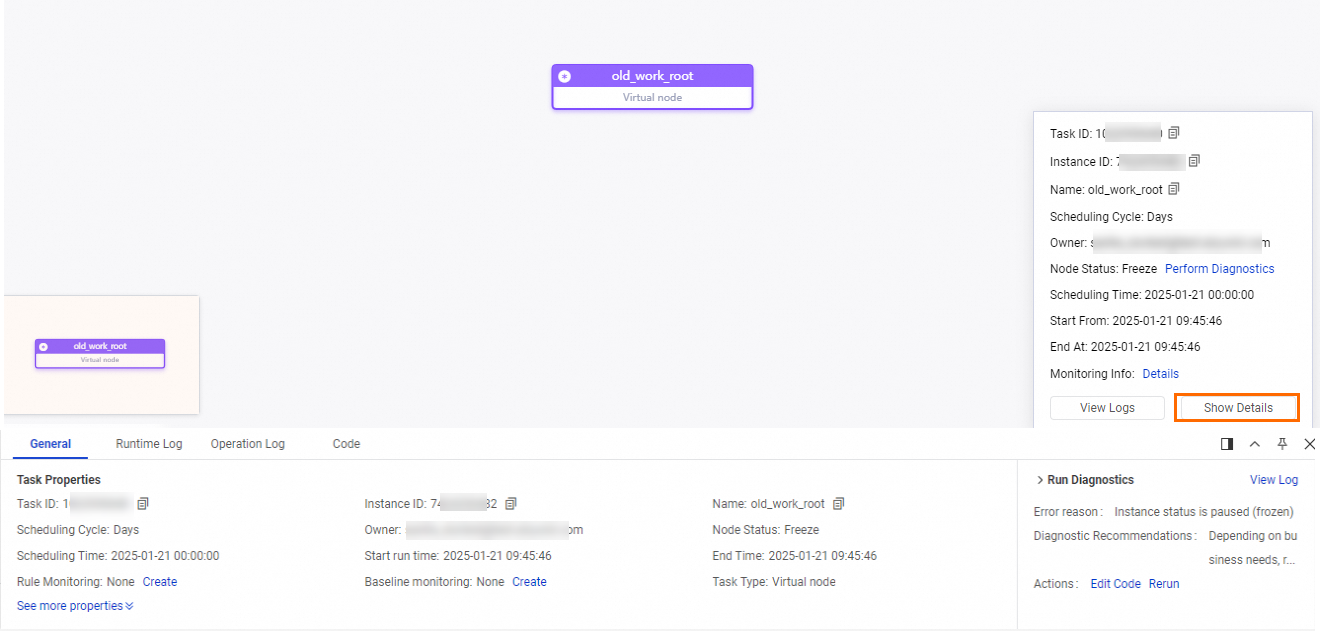
When you click an instance, a pane that shows the instance details appears in the lower-right corner of the page. You can click Expand Details in the pane to view the details of the instance. The following figure uses a recurring instance as an example.
Feature
Description
Properties
On this tab, you can view the scheduling properties of the task in the production environment. For more information about the parameters on the interface, see Scheduling Configuration.
Relationship between node ID and instance ID:
For nodes that are scheduled hourly or by the minute, you can use the node ID to locate all hourly or minute-level instances generated for that node on the current day. To locate a specific hourly or minute-level instance, use the instance ID.
Understanding task status: The task status is related to the task run. If a task is in a state such as Not Run, Waiting for Time, Waiting for Resource, or Frozen, you can use Run Diagnosis to quickly locate the issue.
Time waiting for resources: If a task waits for resources for a long time, you can use the Run Diagnosis feature to locate which tasks are occupying resources when the current task is running. This helps you quickly find and troubleshoot abnormal tasks.
Excessive runtime: If a task's runtime is significantly longer than its historical runtimes, you can handle it based on the following scenarios.
For non-sync tasks, you can consult the owner of the corresponding engine.
Offline sync tasks: A certain stage of the task may be running slowly or waiting for resources for a long time. For more information, see Batch synchronization.
Rule monitoring: You can view the monitoring rules associated with the current instance. You can click Create on the right to quickly create a monitoring rule for the task's running status. For more information, see Rule management.
NoteHere, you can only view the details of rules that monitor the running status of a task. You cannot view Data Quality monitoring rules.
Baseline monitoring: You can view the baselines associated with the current instance. You can click Create on the right to quickly create a baseline. For more information, see Baseline management.
Operational Log
Used to view the detailed execution process of the task.
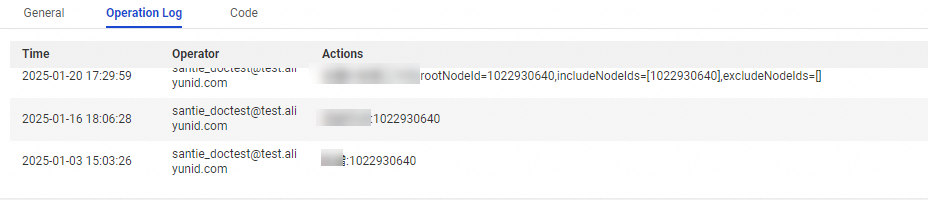
Operation Logs
Used to view the operation records (time, operator, specific operation) for the task or instance.
Code
Used to view the latest code of the current task in the production environment. If the code is not as expected, confirm whether the latest version of the task has been published. For more information, see Publish a task.