The Quality Dashboard page provides an overview of data quality in a workspace, including the main data quality metrics, the trend and distribution of rule-based check instances, the top N tables sorted based on the number of data quality issues, the owners of the issues, and the coverage status of monitoring rules. This helps data quality owners understand the overall data quality condition of the workspace and handle data quality issues at the earliest opportunity to improve data quality.
Go to the Quality Dashboard page
Go to the Data Quality page.
Log on to the DataWorks console. In the top navigation bar, select the desired region. In the left-side navigation pane, choose . On the page that appears, select the desired workspace from the drop-down list and click Go to Data Quality.
In the left-side navigation pane of the Data Quality page, click Quality Dashboard.
Usage notes
The Quality Dashboard page provides statistics on the data quality of a workspace.
In the upper-right corner of the Quality Dashboard page, you can select Today, Yesterday, The Day Before Yesterday, or another specific day based on your business requirements to view the statistics on data quality in the selected time range. By default, Today is selected.
You can also select View Only Data in Production Environment to view the statistics on data quality in the workspace only in the production environment.
NoteIf you select View Only Data in Production Environment, the check results of tables in the workspace in the development environment are not included in the statistics. Only workspaces in standard mode provide both the development environment and production environment and isolate the environments. All data tables in a workspace in basic mode are in the production environment. For more information, see Comparison of basic mode and standard mode.
You can also view the data quality overview of a workspace from the following perspectives:
All data sources: If you select All, the Quality Dashboard page displays the statistics on data quality of all types of data sources in the current workspace.
Specific data source: If you select a specific data source, such as MaxCompute, E-MapReduce, Hologres, CDH Hive, AnalyticDB for PostgreSQL, AnalyticDB for MySQL, StarRocks or MySQL, the Quality Dashboard page displays the statistics on data quality of the data source in the current workspace.
NoteStatistics on streaming data are not supported.
Main data quality metrics
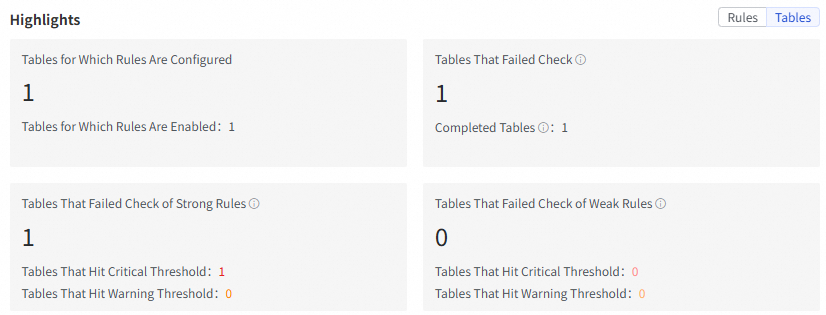
On the right side of the Highlights section, you can click Rules or Tables to view the data quality statistics related to rules or tables.
Category | Metric | Description |
Table | Tables for Which Rules Are Configured | The number of tables for which monitoring rules are configured in the current workspace as of the date that is selected in the upper-right corner of the Quality Dashboard page. |
Tables That Failed Check | The number of tables that failed the check based on monitoring rules after the running of the rule-based check instances is complete on the current day. The tables that failed the quality threshold check and tables that failed the system check are included. Completed Tables: The number of tables for which the related rule-based check instances are identified and the running of the instances is complete on the current day. The running of rule-based check instances is considered complete in the following scenarios: Tables passed the quality check, tables failed the quality check, and tables failed the system check. | |
Tables That Failed Check of Strong Rules | The number of tables that failed the check based on strong monitoring rules after the running of the rules is complete on the current day. The tables that failed the quality threshold check and tables that failed the system check are included. Tables That Hit Critical Threshold: the number of tables that failed the critical threshold check based on a strong monitoring rule on the current day. Tables That Hit Warning Threshold: the number of tables that failed the warning threshold check based on a strong monitoring rule on the current day. | |
Tables That Failed Check of Weak Rules | The number of tables that failed the check based on weak monitoring rules after the running of the rules is complete on the current day. The tables that failed the quality threshold check and tables that failed the system check are included. Tables That Hit Critical Threshold: the number of tables that failed the critical threshold check based on a weak monitoring rule on the current day. Tables That Hit Warning Threshold: the number of tables that failed the warning threshold check based on a weak monitoring rule on the current day. | |
Rule | Total Rules | The total number of monitoring rules that are created in the current workspace as of the current day. |
Rules Based on Which Tables Failed Check | The number of monitoring rules based on which tables failed the check after the running of the rule-based check instances is complete on the current day. The quality threshold rules and system check rules are included. Completed Rules: The number of monitoring rules for which the running of the related rule-based check instances is complete on the current day. The running of rule-based check instances is considered complete in the following scenarios: Tables passed the quality check, tables failed the quality check, and tables failed the system check. | |
Strong Rules Based on Which Tables Failed Check | The number of strong monitoring rules based on which tables failed the check after the running of the rule-based check instances is complete on the current day. The quality threshold rules and system check rules are included. Rules Based on Which Tables Hit Critical Threshold: the number of strong monitoring rules based on which tables failed the critical threshold check after the running of the rule-based check instances is complete on the current day. Rules Based on Which Tables Hit Warning Threshold: the number of strong monitoring rules based on which tables failed the warning threshold check after the running of the rule-based check instances is complete on the current day. | |
Weak Rules Based on Which Tables Failed Check | The number of weak monitoring rules based on which tables failed the check after the running of the rule-based check instances is complete on the current day. The quality threshold rules and system check rules are included. Rules Based on Which Tables Hit Critical Threshold: the number of weak monitoring rules based on which tables failed the critical threshold check after the running of the rule-based check instances is complete on the current day. Rules Based on Which Tables Hit Warning Threshold: the number of weak monitoring rules based on which tables failed the warning threshold check after the running of the rule-based check instances is complete on the current day. |
Overview of rule-based check
The Quality Monitoring Overview section displays the trend and distribution of rule-based check instances.
Instance Trend Analysis
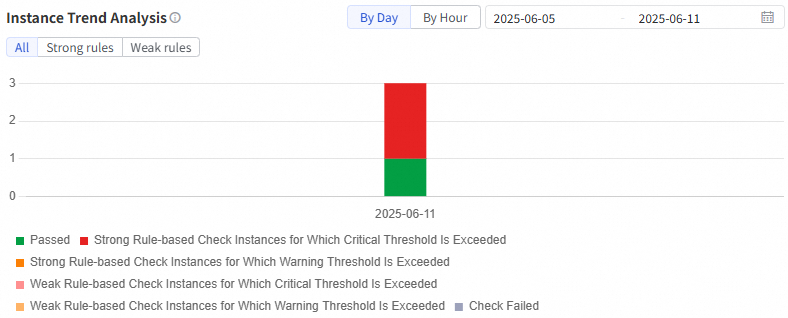
Displays the trend of the number of rule-based check instances that have different check results. You can click By Day or By Hour to view the trend from the selected perspective. You can select All, Strong rules, or Weak rules to view the trend of the number of rule-based check instances that have check results of all types of monitoring rules, check results of only strong monitoring rules, and check results of only weak monitoring rules.
Instance Running Status
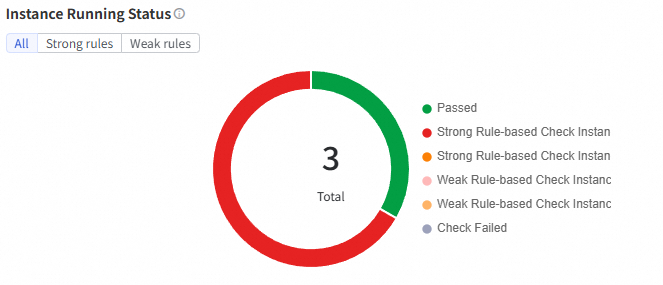
Displays the distribution of rule-based check instances with different check results. You can view the number of rule-based check instances that are run on the current day. You can select All, Strong rules, or Weak rules to view the distribution of rule-based check instances with check results of all types of monitoring rules, check results of only strong monitoring rules, and check results of only weak monitoring rules. Rule-based check results:
Passed: The rule-based check is successful and the table passed the quality threshold check.
Strong Rule-based Check Instances for Which Critical Threshold Is Exceeded: The critical threshold check of a strong monitoring rule failed.
Strong Rule-based Check Instances for Which Warning Threshold Is Exceeded: The warning threshold check of a strong monitoring rule failed.
Weak Rule-based Check Instances for Which Critical Threshold Is Exceeded: The critical threshold check of a weak monitoring rule failed.
Weak Rule-based Check Instances for Which Warning Threshold Is Exceeded: The warning threshold check of a weak monitoring rule failed.
Check Failed: The rule-based check failed to be executed and the system failed to obtain the check value.
Overview of the top N tables that have the maximum number of data quality issues
Based on the ranking of the numbers of monitoring rules for tables, the Top N Tables with Maximum Number of Quality Issues section displays the statistics on the Top N Tables with Maximum Number of Quality Issues sorted based on the number of data quality issues within the specified time range and the Owners of Top N Tables with Maximum Number of Quality Issues section displays the owners of the issues. You can click View more in the upper-right corner to go to the Running Records page. On this page, you can view the historical checks and check details and resolve data quality issues at the earliest opportunity.
The owner of a monitoring rule is the data quality owner of a data table partition. In most cases, the owner is the user who creates a partition filter expression.
Data quality configuration analysis
The Quality Configuration Analysis section displays the overall coverage of monitoring rules from the following dimensions: Asset Ratio of Tables for Which Rules Are Configured, Number of Tables for Which No Rules Are Configured, Number of Tables for Which No Rules Are Enabled, Number of Tables Configured with Rules with Which No Scheduling Node Is Associated, and Number of Tables Configured with Rules for Which No Alert Recipient Is Configured. You can also click View Details in the Actions column of a table to view the rule configuration details of the table from this dimension. 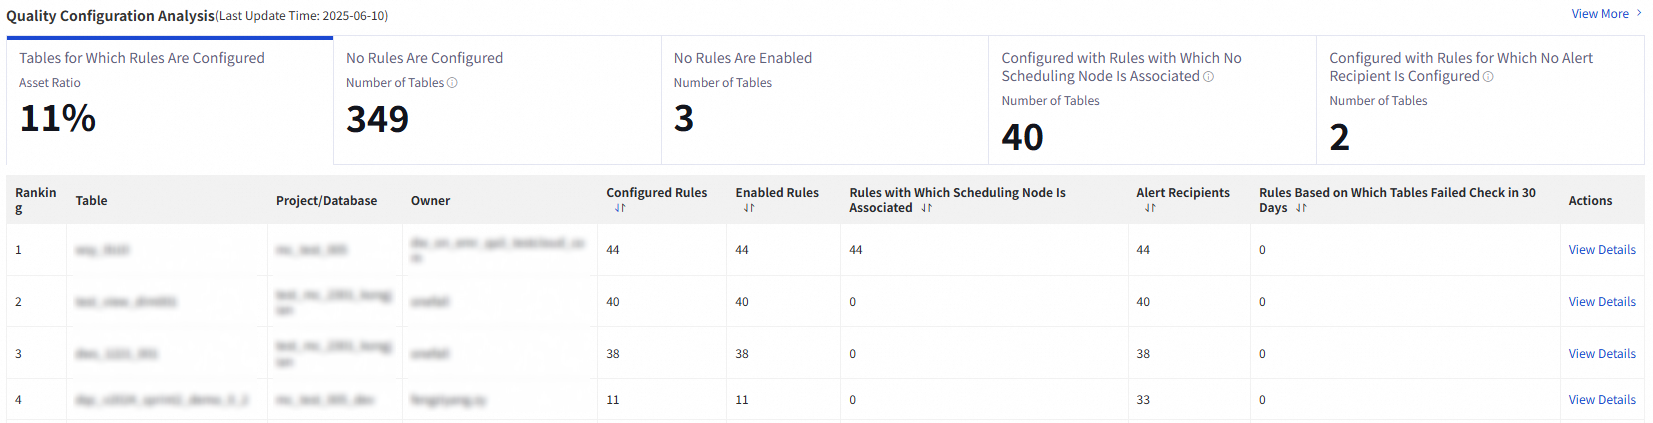 Description of each dimension:
No Rules Are Configured: Tables for which no monitoring rule is configured are included in statistics.
NoteThis dimension is supported only for MaxCompute data sources.
No Rules Are Enabled: Tables for which no monitoring rule is enabled are included in statistics.
Configured with Rules with Which No Scheduling Node Is Associated: Tables configured with rules with which no scheduling node is associated are included in statistics. If no scheduling node is associated with a monitoring rule, the monitoring rule can be executed only in a test run.
Configured with Rules for Which No Alert Recipient Is Configured: Tables configured with rules for which no alert recipient is configured are included in statistics. If no alert recipient is configured for a monitoring rule, no one can receive the check result in a timely manner if data quality issues occur during the rule execution.