Only listed assets support viewing asset details. Learn how to view dashboard asset details.
Prerequisites
The asset operation value-added service has been purchased, and the current tenant has activated the asset operation module.
Dashboard asset details
-
On the Dataphin home page, select Asset > Asset Catalog from the top menu bar.
-
Click on the Dashboard asset tab and select the name of the target asset to access its details page.
Area
Description
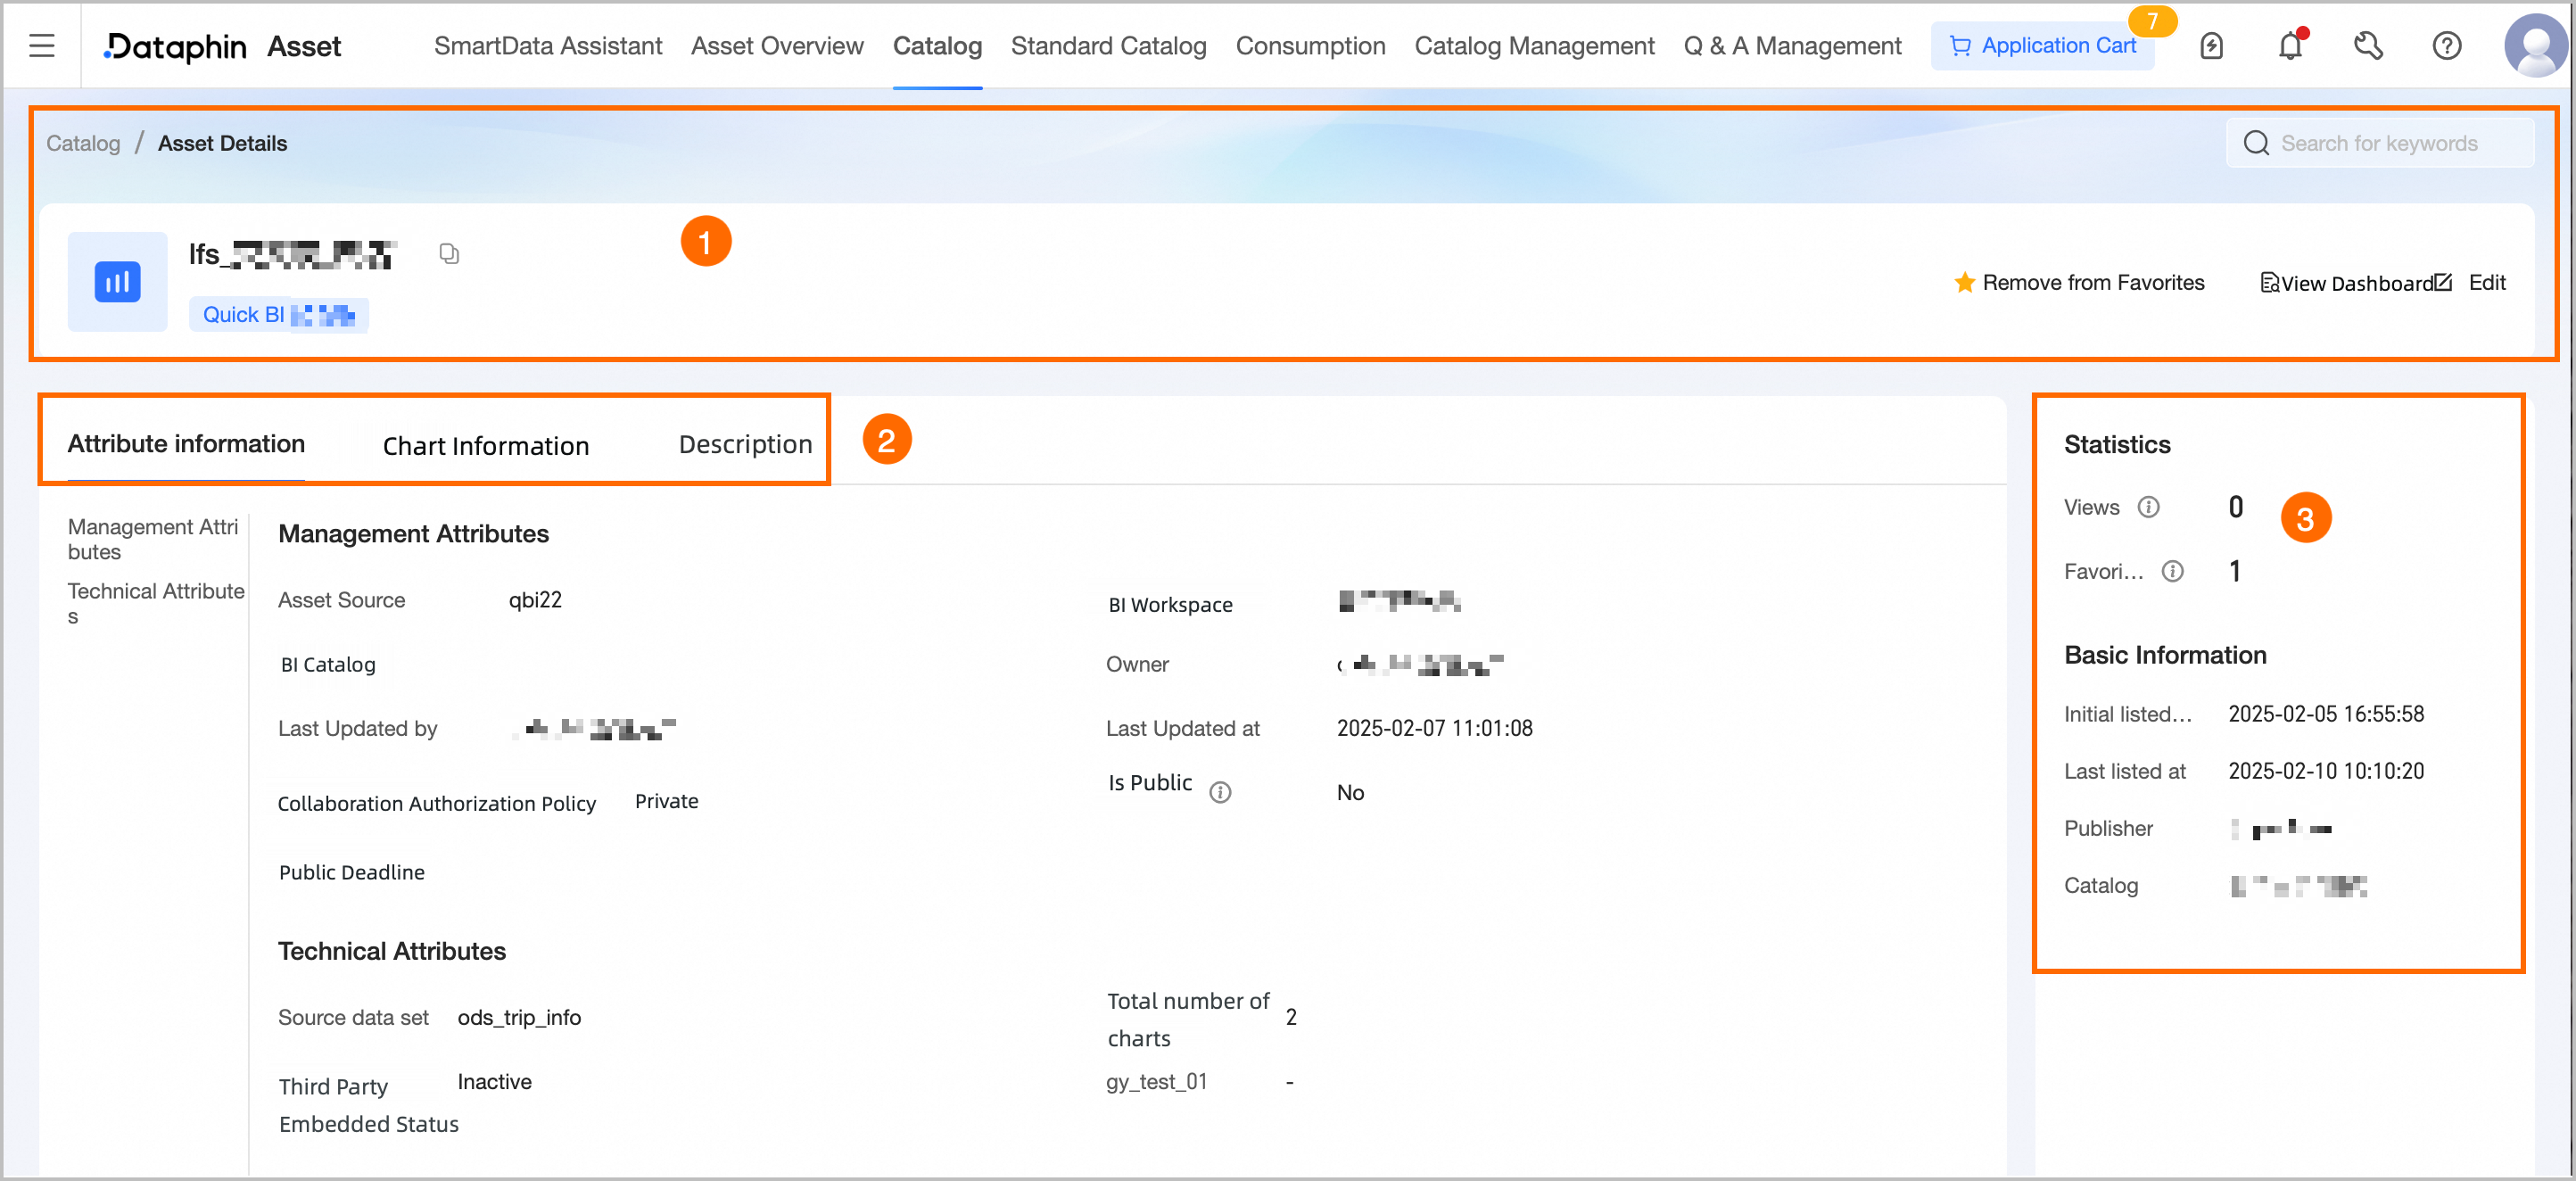
①Summary information
Shows the dashboard's name, type, description, and tags. You can perform the following operations:
-
Search assets: Quickly search for other dashboards and navigate to their details pages.
-
Favorite: Add or remove the dashboard from your favorites. Favorited assets can also be viewed in the Personal Data Center. For more information, see view and manage my favorited assets.
-
View dashboard: Click View Dashboard to open the dashboard details page in Quick BI.
-
Edit: Available to users with dashboard maintenance permissions. Click Edit to go to the dashboard asset editing page under catalog management, where you can modify asset properties, usage instructions, and more. For more information, see edit asset information.
②Basic information
-
Property information: Shows the dashboard's management and technical properties.
-
Management properties: Shows asset source, associated BI workspace, associated BI catalog, owner, last updated by, last update time, collaborative authorization policy, public status, public deadline, and custom properties.
-
Asset source: The published dashboard information collected from the Quick BI workspace through the collection adapter.
-
Public status: Public reports can be accessed directly via a link without logging in. Non-public reports require logging into Quick BI.
-
-
Technical properties: Shows source dataset, total number of charts, third-party embed status, and custom properties.
-
-
Chart information: Shows the latest collected chart details, including ordinal number, display name (chart name), chart type, field type, field name/data type, and description.
You can search by chart name or description, or filter by chart type, dimension, or measure.
-
Usage instructions: Must be enabled on the dashboard asset editing page for manually listed assets. Provides usage guidance for data viewers and users.
③Asset information
Shows the dashboard's Usage Statistics and Basic Information.
-
Usage statistics: Includes the dashboard's page views and number of favorites.
-
Page Views: The dashboard's page view count (PV). Each refresh increments the count by one, updated in real time. Only includes views of the asset catalog details page.
-
Number Of Favorites: The number of times users have favorited this dashboard in the asset catalog, updated in real time.
-
-
Basic information: Includes initial listing time, recent listing time, publisher, and associated catalog.
-