Dataphin lets you configure monitoring and alerting rules for multiple nodes and fields in batches. You can monitor physical nodes and logical table tasks at the node level, and logical table fields at the field level. Batch configuration improves efficiency and helps you promptly detect and handle alerts.
Prerequisites
Make sure you meet one of the following conditions:
-
You have submitted nodes from a Basic project to the production environment.
-
Jobs from the Dev project have been published to the production environment. For more information, see Manage Published Jobs or .
Limits
-
You can configure monitoring and alerting rules only for nodes in the production environment.
-
You can select up to 100 monitored objects in a single configuration. Monitored objects include nodes and logical table fields.
Configure the same monitoring and alerting rules for multiple nodes or fields
-
In the top menu bar of the Dataphin home page, choose Develop > O&M.
-
In the navigation pane on the left, choose Monitoring Management > Offline Node Monitoring.
-
On the Offline Node Monitoring page, click the Node Monitoring or Field Monitoring tab. On the corresponding tab, click Create Offline Monitoring Rule and select Batch Configure for Monitored Objects.
-
In the Create Offline Node Monitoring Rule (Batch Configure for Monitored Objects) dialog box, configure the monitoring parameters.
-
Configure alert conditions
Parameter
Description
Alert Condition
You can configure alerts for the following events:Error, Not Completed, Timeout, Completed, and Data Latency.
-
Error: An alert is triggered if a node-level task fails during runtime. An alert is also triggered if any field in a logical table fails.
NoteDataphin automatically retries a failed node until the maximum number of retries is reached. An alert is triggered only if the node still fails after all retries.
-
Not Completed: To configure this alert, you must specify the object type to monitor and a time point as the trigger condition. An alert is triggered if the node has not completed by this time. You can monitor nodes with daily, weekly, or monthly scheduling cycles and nodes with hourly or minute-level scheduling cycles.
NoteChanges to the Not Completed alert configuration take effect the next day.
-
Nodes with daily, weekly, or monthly scheduling cycles: An alert is triggered if a node does not complete within the specified Trigger Condition time. The time zone for the trigger condition matches the Monitoring Period time zone. For more information, see the description below.
-
Nodes with hourly or minute-level scheduling cycles: The trigger conditions are Not completed after a specific time and Instance not completed after its scheduled runtime.
-
Not completed after a specific time: For a specified cycle of a monitored hourly or minute-level node, an alert is triggered if the node has not completed by the specified time. You can specify a cycle range from 1 to 288 cycles. To add multiple cycles, click +Add Cycle. You can add up to 24 non-overlapping cycles. The time zone for the Monitoring Time Point matches the Monitoring Period time zone. For more information, see the description below.
-
Instance not completed after its scheduled runtime: For a specified monitoring cycle of a monitored hourly or minute-level node, an alert is triggered if the instance has not completed within a specified time after its scheduled runtime. You can quickly select All, First cycle, Last cycle, or a Custom range. The cycle range is from 1 to 288 cycles.
Important-
For Not Completed alerts, changing the scheduling cycle of a monitored node to hourly or minute-level invalidates the corresponding monitoring rule.
-
An alert is triggered if a logical table has incomplete fields at the specified time point. This is valid only for daily nodes.
-
-
-
-
Timeout: To configure this alert, you must set a timeout duration. The valid range is 0 to 19,999 minutes. If you enter a value outside this range, the system uses the nearest valid value. The timer starts when the instance status changes to Running. An alert is triggered if a node-level task or a logical table field has not finished running within the specified duration.
-
Completed: An alert is triggered after a node-level task finishes running. For a dimension table, an alert is triggered after all fields finish running. For an aggregate table, an alert is triggered when any metric is completed.
-
Data Latency: An alert is triggered when data latency occurs. This alert can be configured only for logical fact tables with data latency monitoring enabled.
Alert Frequency
The frequency at which alerts are sent. The valid range is 1 to 59 minutes per alert. If you enter a value outside this range, the system uses the nearest valid value.
Monitoring Period
The time range during which monitoring is active. Select All Day or a Specific Period. For a specific period, configure the Start Time and End Time based on the system time zone.
If the system time zone (the time zone in the User Center) is different from the scheduling time zone, the system displays both time zones. After you select a start time for the specific period, the system automatically calculates the corresponding time in the scheduling time zone. If the calculated scheduling time zone is on a different day than the system time zone,
(-1)indicates the previous day and(+1)indicates the next day. For example, if the system time zone is GMT+08:00 and the scheduling time zone is GMT+01:00, and you configure the specific period as00:00 ~ 01:00, the corresponding time in the scheduling time zone is17:00(-1) ~ 18:00(-1).Send Count
The number of times an alert is sent when triggered. The valid range is an integer from 1 to 10. If you enter a value outside this range, the system uses the nearest valid value.
Recipient Configuration
The configuration for alert recipients. Recipients can be the Owner, an On-call Schedule, or Custom. To add recipients, click +Add Recipient.
-
Owner: The owner of the node.
-
On-call Schedule: The on-call schedule configured in the Alert Center. You must create an on-call schedule in advance. For more information, see Create an on-call schedule.
-
Custom: Use this option to send alerts to users other than the owner or on-call personnel, such as a project administrator.
Notification Method: Supported methods include DingTalk, text message, phone call, email, Lark, WeCom, and custom channels.
ImportantSelect the contact methods for the recipients. For information about how to configure contact methods, see Add a Dataphin member.
-
-
-
After you configure the monitoring and alerting rules, click Next.
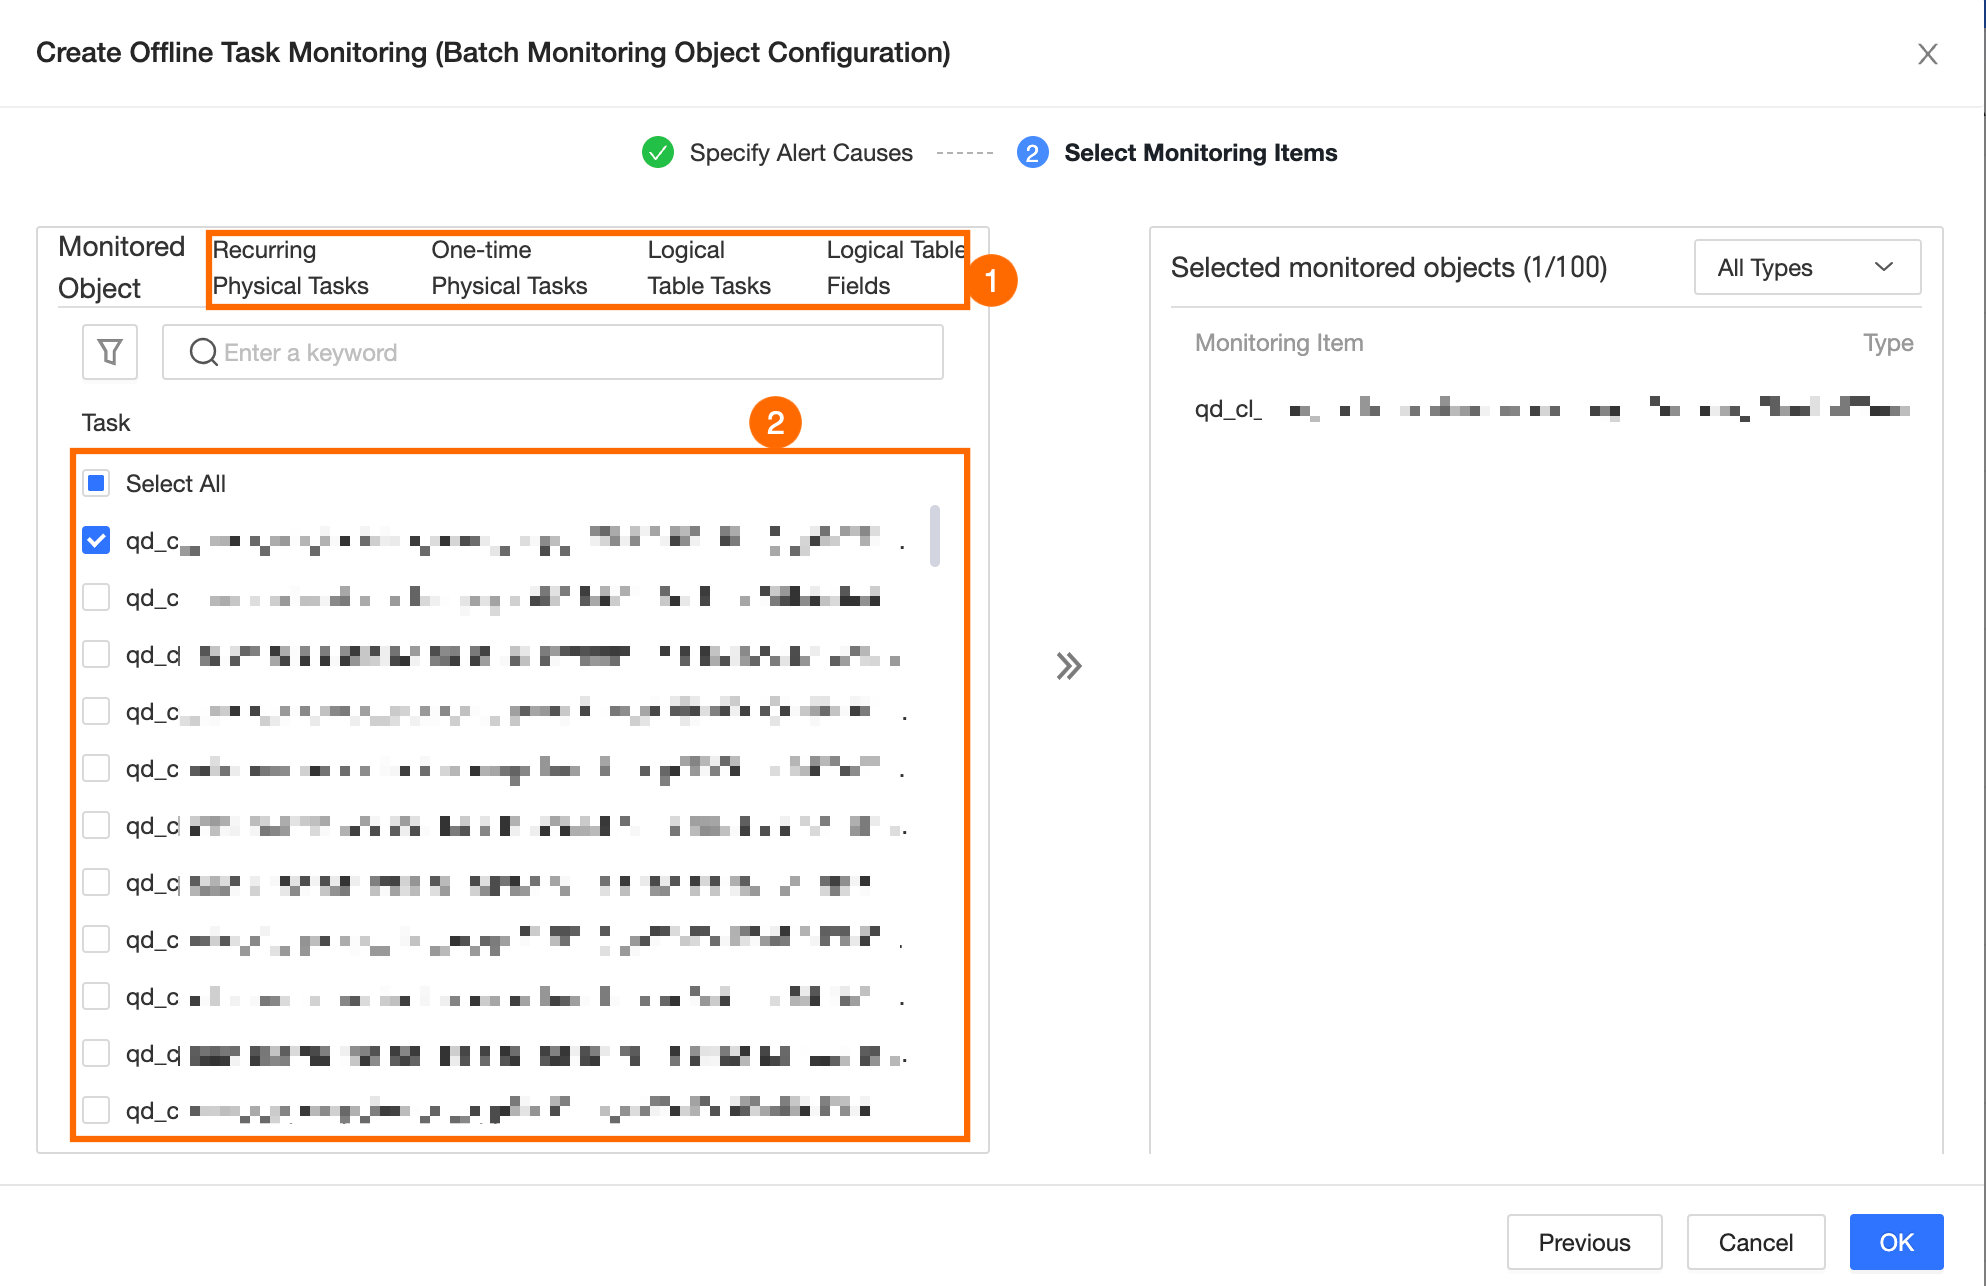
On the Select Monitored Objects tab, select the nodes to monitor with this alert rule, as shown in the following figure.
NoteYou can select only nodes within the current tenant. You cannot configure monitoring for upstream or descendant nodes that belong to other tenants.
-
Click OK.
Configure multiple monitoring and alerting rules for a single node or field
-
On the Node Monitoring or Field Monitoring tab, click Create Offline Monitoring Rule and select Batch Configure Monitoring Rules.
-
In the Create Offline Node Monitoring Rule (Batch Configure Monitoring Rules) dialog box, configure the following parameters.
-
Monitored Node: Select the node or logical table field for which you want to configure monitoring rules.
-
Alert Condition: Click +Create Alert Condition and select an alert condition. You can configure alerts for Error, Not Completed, Timeout, Completed, and Data Latency events. The parameters are the same as those for batch configuration of monitored objects. For more information, see Parameter descriptions.
-
-
Click OK.
What to do next
You can view all alert events in the Alert Center. For more information, see Alert Events.