To collect the metrics of the specified GPU-HPN node or virtual node in an ACS cluster, ACS provides multiple metric collection endpoints. You can use these endpoints in Prometheus to collect different metrics from the specified node.
Introduction
The architecture of ACS allows multiple virtual nodes in the same cluster to share an IP address. Consequently, when you collect the data of an individual virtual node, the data of all virtual nodes is returned. Prometheus usually uses the kubelet Service to collect the metrics of all nodes. In this case, duplicate metrics will be collected.
To resolve this problem, ACS enables you to collect the metrics of the specified node by specifying the name of the node. The returned result contains only data of the node and data of the pods on the node.
Endpoint | Parameter description | Metric type |
|
| Collect pod-level metrics, such as the CPU, memory, and GPU usage. |
|
| Important Only GPU-HPN nodes support this endpoint. Collect node-level metrics, such as the CPU, memory, and GPU usage. For more information, see ACS GPU-HPN node metrics. |
Prerequisites
The version of the acs-virtual-node component is v2.12.0-acs.10 or later.
To view the version of the acs-virtual-node component or update it, choose in the left-side navigation pane of the ACS cluster management page, and click the Core Components tab.
Modify the Prometheus configuration
You can modify the Prometheus configuration to collect the metrics of the specified virtual node by using one of the following methods.
Managed Service for Prometheus
You can directly use Managed Service for Prometheus to collect the metrics of the specified virtual node without any additional configuration.
Update the Prometheus dashboard and probes to the latest version to ensure that you can view the complete dashboard. For more information, see How do I update the Prometheus dashboard for ACS clusters?.
Open source Prometheus operator
If you use the open source Prometheus operator solution and the ack-prometheus-operator from the ACK marketplace, you need to add the following ServiceMonitor CR.
apiVersion: monitoring.coreos.com/v1
kind: ServiceMonitor
metadata:
  name: virtual-kubelet-acs
  namespace: monitoring
  labels:
    k8s-app: kubelet
    # Add this label to automatically manage prometheus-operator.
    release: prometheus-operator
spec:
  jobLabel: k8s-app
  selector:
    matchLabels:
      k8s-app: kubelet
  namespaceSelector:
    matchNames:
    - kube-system
  endpoints:
  - port: https-metrics
    interval: 15s
    scheme: https
    path: /metrics/cadvisor
    bearerTokenFile: /var/run/secrets/kubernetes.io/serviceaccount/token
    tlsConfig:
      caFile: /var/run/secrets/kubernetes.io/serviceaccount/ca.crt
      insecureSkipVerify: true
    relabelings:
    # Add parameters to query based on the specified nodeName.
    - sourceLabels: [__meta_kubernetes_endpoint_address_target_name]
      targetLabel: __param_nodeName
      replacement: ${1}
      action: replace
  - port: https-metrics
    interval: 15s
    scheme: https
    path: /metrics/node
    bearerTokenFile: /var/run/secrets/kubernetes.io/serviceaccount/token
    tlsConfig:
      caFile: /var/run/secrets/kubernetes.io/serviceaccount/ca.crt
      insecureSkipVerify: true
    relabelings:
    # Only ACS reserved GPU nodes provide node-level monitoring data.
    - source_labels:
      - __meta_kubernetes_node_label_alibabacloud_com_node_type
      separator: ;
      regex: reserved
      replacement: $1
      action: keep
    # Add parameters to query based on the specified nodeName.
    - sourceLabels: [__meta_kubernetes_endpoint_address_target_name]
      targetLabel: __param_nodeName
      replacement: ${1}
      action: replace
Open-source Prometheus
In open source Prometheus, find the configuration file (usually located in /etc/prometheus/prometheus.yml or in your custom configuration directory), and add the following metric collection configuration.
scrape_configs:
# ...Other job configurations.
- job_name: monitoring/acs-virtual-kubelet/cadvisor
  honor_timestamps: true
  scrape_interval: 15s
  scrape_timeout: 10s
  metrics_path: /metrics/cadvisor
  scheme: https
  bearer_token_file: /var/run/secrets/kubernetes.io/serviceaccount/token
  tls_config:
    ca_file: /var/run/secrets/kubernetes.io/serviceaccount/ca.crt
    insecure_skip_verify: true
  relabel_configs:
  - source_labels: [__meta_kubernetes_service_label_k8s_app]
    separator: ;
    regex: kubelet
    replacement: $1
    action: keep
  - source_labels: [__meta_kubernetes_endpoint_port_name]
    separator: ;
    regex: https-metrics
    replacement: $1
    action: keep
  - source_labels: [__meta_kubernetes_endpoint_address_target_kind, __meta_kubernetes_endpoint_address_target_name]
    separator: ;
    regex: Node;(.*)
    target_label: node
    replacement: ${1}
    action: replace
  - source_labels: [__meta_kubernetes_endpoint_address_target_kind, __meta_kubernetes_endpoint_address_target_name]
    separator: ;
    regex: Pod;(.*)
    target_label: pod
    replacement: ${1}
    action: replace
  - source_labels: [__meta_kubernetes_namespace]
    separator: ;
    regex: (.*)
    target_label: namespace
    replacement: $1
    action: replace
  - source_labels: [__meta_kubernetes_service_name]
    separator: ;
    regex: (.*)
    target_label: service
    replacement: $1
    action: replace
  - source_labels: [__meta_kubernetes_pod_name]
    separator: ;
    regex: (.*)
    target_label: pod
    replacement: $1
    action: replace
  - source_labels: [__meta_kubernetes_pod_container_name]
    separator: ;
    regex: (.*)
    target_label: container
    replacement: $1
    action: replace
  - source_labels: [__meta_kubernetes_service_name]
    separator: ;
    regex: (.*)
    target_label: job
    replacement: ${1}
    action: replace
  - source_labels: [__meta_kubernetes_service_label_k8s_app]
    separator: ;
    regex: (.+)
    target_label: job
    replacement: ${1}
    action: replace
  - separator: ;
    regex: (.*)
    target_label: endpoint
    replacement: https-metrics
    action: replace
  - source_labels: [__meta_kubernetes_endpoint_address_target_name]
    separator: ;
    replacement: $1
    action: keep
  - source_labels: [__meta_kubernetes_endpoint_address_target_name]
    separator: ;
    target_label: __param_nodeName
    replacement: ${1}
    action: replace
  kubernetes_sd_configs:
  - role: endpoints
    namespaces:
      names:
      - kube-system
- job_name: monitoring/acs-virtual-kubelet/node
  honor_timestamps: true
  scrape_interval: 15s
  scrape_timeout: 10s
  metrics_path: /metrics/node
  scheme: https
  bearer_token_file: /var/run/secrets/kubernetes.io/serviceaccount/token
  tls_config:
    ca_file: /var/run/secrets/kubernetes.io/serviceaccount/ca.crt
    insecure_skip_verify: true
  relabel_configs:
  - source_labels:
    - __meta_kubernetes_node_label_alibabacloud_com_node_type
    separator: ;
    regex: reserved
    replacement: $1
    action: keep
  - source_labels: [__meta_kubernetes_service_label_k8s_app]
    separator: ;
    regex: kubelet
    replacement: $1
    action: keep
  - source_labels: [__meta_kubernetes_endpoint_port_name]
    separator: ;
    regex: https-metrics
    replacement: $1
    action: keep
  - source_labels: [__meta_kubernetes_endpoint_address_target_kind, __meta_kubernetes_endpoint_address_target_name]
    separator: ;
    regex: Node;(.*)
    target_label: node
    replacement: ${1}
    action: replace
  - source_labels: [__meta_kubernetes_endpoint_address_target_kind, __meta_kubernetes_endpoint_address_target_name]
    separator: ;
    regex: Pod;(.*)
    target_label: pod
    replacement: ${1}
    action: replace
  - source_labels: [__meta_kubernetes_namespace]
    separator: ;
    regex: (.*)
    target_label: namespace
    replacement: $1
    action: replace
  - source_labels: [__meta_kubernetes_service_name]
    separator: ;
    regex: (.*)
    target_label: service
    replacement: $1
    action: replace
  - source_labels: [__meta_kubernetes_pod_name]
    separator: ;
    regex: (.*)
    target_label: pod
    replacement: $1
    action: replace
  - source_labels: [__meta_kubernetes_pod_container_name]
    separator: ;
    regex: (.*)
    target_label: container
    replacement: $1
    action: replace
  - source_labels: [__meta_kubernetes_service_name]
    separator: ;
    regex: (.*)
    target_label: job
    replacement: ${1}
    action: replace
  - source_labels: [__meta_kubernetes_service_label_k8s_app]
    separator: ;
    regex: (.+)
    target_label: job
    replacement: ${1}
    action: replace
  - separator: ;
    regex: (.*)
    target_label: endpoint
    replacement: https-metrics
    action: replace
  - source_labels: [__meta_kubernetes_endpoint_address_target_name]
    separator: ;
    replacement: $1
    action: keep
  - source_labels: [__meta_kubernetes_endpoint_address_target_name]
    separator: ;
    target_label: __param_nodeName
    replacement: ${1}
    action: replace
  kubernetes_sd_configs:
  - role: endpoints
    namespaces:
      names:
      - kube-system
FAQ
How do I quickly view node metrics?
How do I update the Prometheus dashboard for ACS clusters?
Log on to the ARMS console, and click Integration Management.
Click the Integrated Environments tab, find the container environment with the same name as your ACS cluster, and click its name to go to the details page.
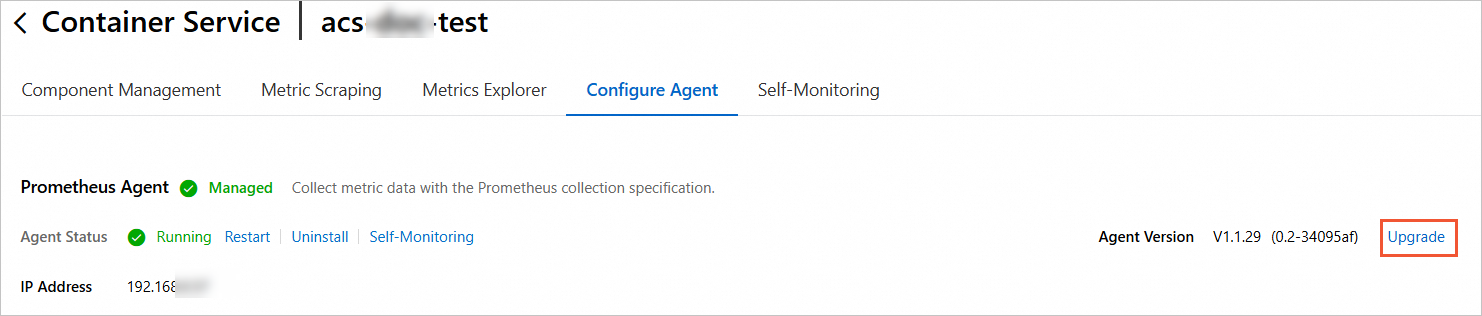
Update the probe
On the Configure Agent tab, check if the Prometheus probe needs an update. If yes, click Upgrade to update the probe.
NoteIf the Upgrade button is not displayed, the probe version is of the latest.
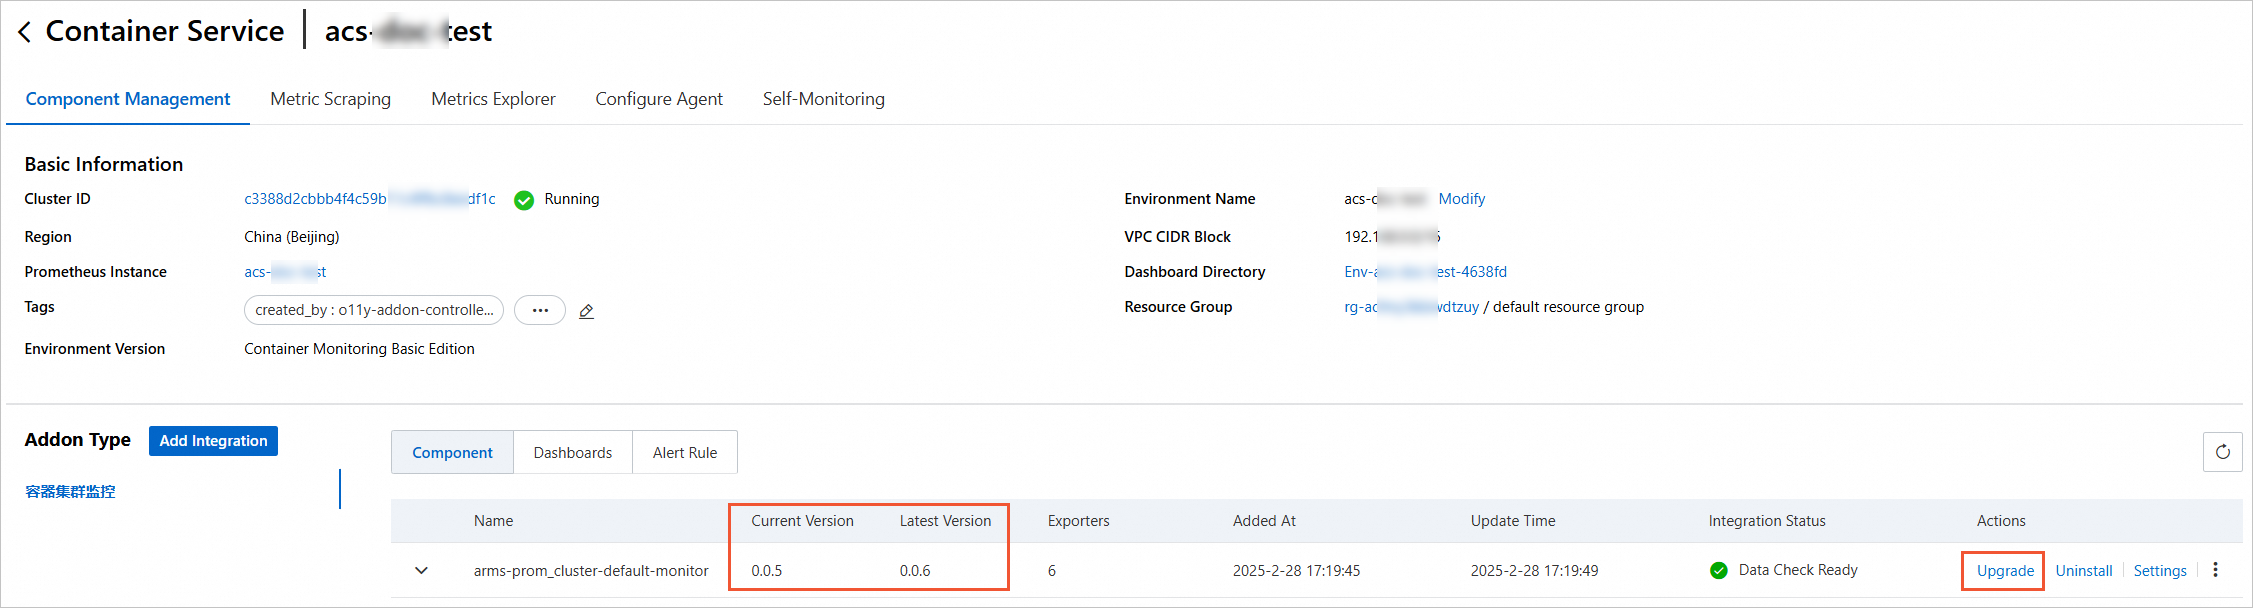
Update the dashboard
On the Component Management tab, check if the component needs an update. If yes, click Upgrade to update the component.