Ingress controllers of Container Service for Kubernetes (ACK) allow you to stream all HTTP request logs to standard outputs. ACK is also integrated with Simple Log Service. You can create dashboards to monitor and analyze log data. This topic describes how to use Ingress Dashboard with Application Real-Time Monitoring Service (ARMS) to monitor applications.
Prerequisites
Step 1: View the Ingress access log on dashboards
Log on to the ACK console. In the left-side navigation pane, click Clusters.
On the Clusters page, find the cluster that you want to manage and click its name. In the left-side pane, click Cluster Information.
On the Basic Information tab, find the Cluster Resources section, and click the project ID next to the Log Service Project parameter.
On the page that appears, click the
 icon. View the reports of NGINX Ingresses on the Dashboard list.
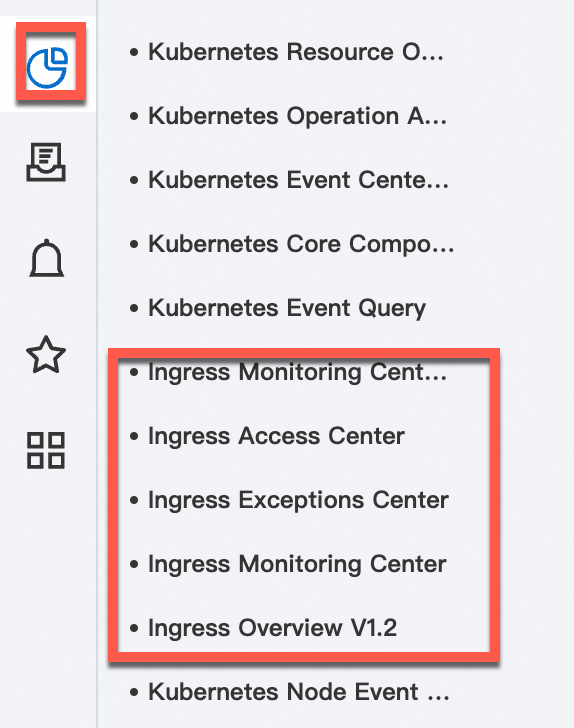
Ingress Dashboard contains five preset charts: Ingress Overview, Ingress Exceptions Center, Ingress Access Center, Ingress Monitoring Center for Blue/Green Deployment, and Ingress Monitoring Center. The following section introduces the Ingress Overview and Ingress Monitoring Center for Blue/Green Deployment charts. For more information about other preset charts, see Analyze and monitor the access log of nginx-ingress-controller.
Ingress Overview
The Ingress overview dashboard displays information about network traffic that flows through nginx-ingress-controller for a website. You can view the following information:
Website data of the last 24 hours, including the number of page views (PVs), the number of unique visitors (UVs), inbound and outbound traffic, the average latency, the proportion of mobile users, and the proportions of 5xx errors and 404 errors.
Website data of the last 1 minute, including the number of PVs, the number of UVs, the success rate of requests, the average latency, the P95 latency, and the P99 latency.
Detailed information about requests within the last 24 hours, including the PV trend of the last 24 hours (based on the PVs within the last 24 hours), the PV trend of the last 7 days (based on the PVs within the last 7 days), regional distribution of request sources, the top N source areas and cities, the proportion of mobile users, and the proportions of Android users and iOS users.
Top N URLs within the last 1 hour, including the 10 URLs with the highest PVs, the 10 URLs with the highest latencies, the 10 URLs that return the most 5xx errors, and the 10 URLs that return the most 404 errors.
Ingress Monitoring Center for Blue/Green Deployment
The Ingress monitoring center for blue-green deployments dashboard displays the real-time monitoring data of the Services that are used to expose the old and new application versions. The dashboard also compares the monitoring data of the Services. This allows you to identify exceptions and roll back the application version at the earliest opportunity. You must specify ServiceA and ServiceB for monitoring data comparison. The dashboard displays the following dynamic monitoring data of each Service: the number of PVs, the proportion of 5xx errors, the success rate of requests, the average latency, the P95 latency, the P99 latency, the P999 latency, and the number of requests.
Step 2: Enable ARMS for a Java application
For more information about how to enable ARMS for Java applications, see Monitor applications.
Step 3: Create an Ingress for the application
Log on to the ACK console. In the left-side navigation pane, click Clusters.
On the Clusters page, find the cluster that you want to manage and click its name. In the left-side pane, choose .
On the Ingresses page, click Create Ingress. Configure the Ingress and click OK.
For more information about how to configure an Ingress, see Create an NGINX Ingress.
Step 4: Use Ingress Dashboard with ARMS
Log on to the Simple Log Service console.
In the Projects section, click the name of the project that you specified when you created the ACK cluster. The details page of the project appears. By default, a project that is named in the format of k8s-log-{cluster-id} is created for the ACK cluster.
In the left-side navigation pane, click the
icon. Click Ingress Overview V1.2 in the Dashboard list to obtain the required information. For example, you can find the Top 10 Request URLs by Latency section and check the URL(ARMS Troubleshooting) field to view the top 10 request URLs sorted by latency. You can click the URL to go to the ARMS trace query page of the corresponding Service. You can view the trace details of the Service in the ARMS console.