This topic describes how service providers can configure business monitoring and alerting for a fully managed service in a Container Service for Kubernetes (ACK) cluster.
In the ACK-based deployment scenario, the method of integrating a single-tenant fully managed service with Managed Service for Prometheus is the same as that of integrating a multi-tenant fully managed service with Managed Service for Prometheus. If the single-tenant fully managed service is deployed in an ACK cluster, the ACK cluster is exclusive to a customer. If the multi-tenant fully managed service is deployed on an ACK cluster, multiple customers share the ACK cluster. After you configure the tenant metric forwarding feature for Managed Service for Prometheus in the ACK cluster, the users and service provider can view the metrics of service instances. (Technical support DingTalk group ID: 31045016300).
Flowchart
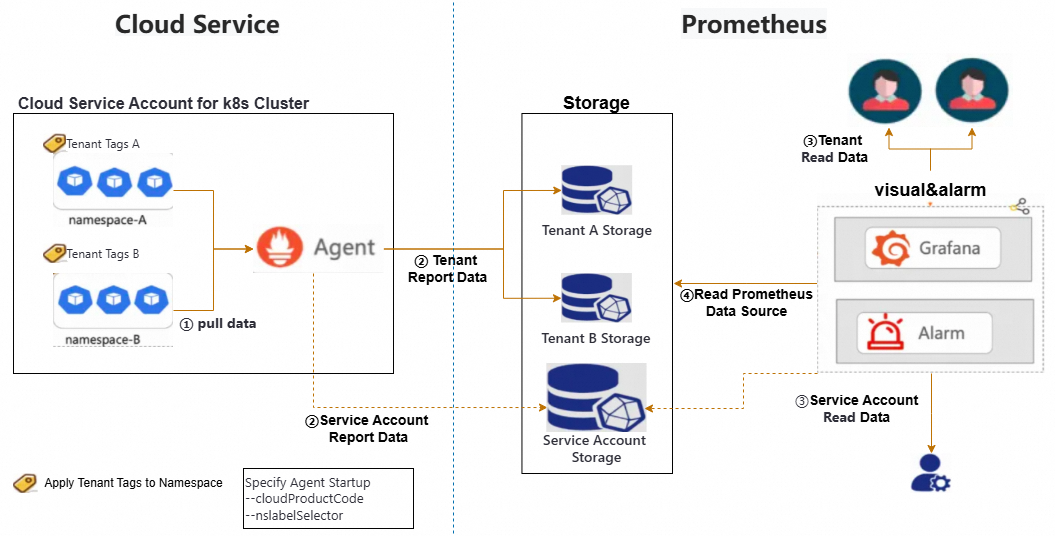
Compute Nest uses the multi-tenant monitoring feature of Managed Service for Prometheus provided by Alibaba Cloud Application Real-Time Monitoring Service (ARMS).
Managed Service for Prometheus provides the built-in multi-tenant capabilities. In the cluster from which metrics need to be collected, the Prometheus agent distinguishes metrics of tenants based on specific tenant tags that are added to workloads at the pod or namespace level. Metrics of different tenants are distributed to the service instances of corresponding tenants.
The storage system naturally supports multi-tenant isolation. A service provider needs to only add the tenant tags to the workloads of different tenants.
A multi-tenant fully managed service of Compute Nest uses namespaces to isolate instance resources of tenants. After tenant tags are added to a namespace, the backend program automatically forwards metrics of a tenant to the corresponding service instance of the tenant.
The remote write feature can be enabled for a service provider to deliver monitoring data of tenants to the service provider account. This way, the service provider can view monitoring data of all tenants, and tenants can only view their own monitoring data.
Procedure
Step 1: Configure the Managed Service for Prometheus component in the ACK cluster
Managed Service for Prometheus does not support metric forwarding. You can configure Managed Service for Prometheus to forward metrics related to user applications to specific users.
Single-tenant fully managed service
In the single-tenant fully managed service, Compute Nest encapsulates the configurations into a module of the Resource Orchestration Service (ROS) template. You can use the module in the ROS template.
Integrate the content into the ROS template when you create a service.
Sample template:
ClusterArmsConfig:
  Type: 'MODULE::ACS::ComputeNest::AckArmsConfig'
  Version: v1
  Properties:
    ClusterId:
      Fn::If:
        - Condition: CreateACKCondition
        - Ref: ManagedKubernetesCluster
        - Ref: ClusterId
    WhetherSupplierNeedMetric: true
    AccessKeyID: LTAI****************
    AccessKeySecret: yourAccessKeySecret
    SupplierAliuid: 15634578xxxxxx
Parameters:
WhetherSupplierNeedMetric: specifies whether the service provider needs to receive tenant data. A value oftrueindicates that the service provider needs to receive tenant metrics. IfWhetherSupplierNeedMetricis set totrue, specifyAccessKeyID,AccessKeySecret, andSupplierAliuid.SupplierAliuidspecifies the Alibaba Cloud Account UID of the service provider, andAccessKeyIDandAccessKeySecretspecify the access key of the service provider.ImportantYou can grant the following permissions on the access key to allow the service provider to only call the
arms:GetPrometheusApiTokenoperation for data collection or query. This configuration follows the principle of least privilege while meeting monitoring requirements, which effectively reduces security risks.{ "Version": "1", "Statement": [ { "Effect": "Allow", "Action": [ "arms:GetPrometheusApiToken" ], "Resource": "*" } ] }SyncServiceMonitor: specifies whether to automatically synchronizeServiceMonitorin the cluster. You can use this option to select theServiceto listen to. For more information, see Use ServiceMonitors to discover and monitor Services.SyncPodMonitor: specifies whether to automatically synchronizePodMonitorin the cluster.
(Optional) If the ACK cluster is newly created by using the ROS template, add the
Addonsparameter to the ACK resources in the ROS template, as shown in the following figure.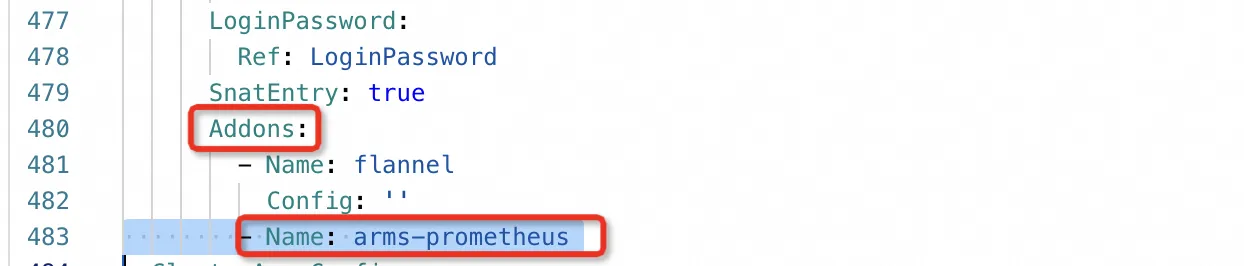
Multi-tenant fully managed service
In the multi-tenant fully managed service scenario, Compute Nest provides the container infrastructure service on the Service Catalog page. You can create a service instance for Managed Service for Prometheus in the ACK cluster.
You can grant the following permissions on the access key to allow the service provider to only call the arms:GetPrometheusApiToken operation for data collection or query. This configuration follows the principle of least privilege while meeting monitoring requirements, which effectively reduces security risks.
{
  "Version": "1",
  "Statement": [
    {
      "Effect": "Allow",
      "Action": [
        "arms:GetPrometheusApiToken"
      ],
      "Resource": "*"
    }
  ]
}Step 2: Configure the ROS template
Create a namespace named after the service instance ID and add tenant tags to the namespace.
Notetenant_userid,tenant_clusterid,tenant_token, andtenant_cloudproductcodeare thekeysof the tenant tags. You only need to enter fixed placeholders in the template. The name of the namespace is set to the {{ serviceInstanceId }} placeholder, which indicates that the namespace is named afterserviceInstanceIdof the created service instance.ClusterNameSpaceApplication: Type: ALIYUN::CS::ClusterApplication Properties: YamlContent: Fn::Sub: - | apiVersion: v1 kind: Namespace metadata: name: '${Name}' labels: tenant_userid: '{{ aliUid }}' tenant_clusterid: '{{ tenantClusterId }}' tenant_token: '{{ tenantToken }}' tenant_cloudproductcode: '{{ tenantCloudProductCode }}' - Name: '{{ serviceInstanceId }}' ClusterId: Fn::If: - Condition: CreateACKCondition - Ref: ManagedKubernetesCluster - Ref: ClusterIdImportantThe application of the service provider must be deployed in the namespace that you created to enable the monitoring system to distribute application metrics to tenants.
(Optional) For the single-tenant fully managed service, the ROS template must reference the
AckArmsConfigmodule to configure Managed Service for Prometheus in each newly created ACK cluster.(Optional) Monitor custom metrics by using HTTP ports or Exporters.
Servicewhose metrics you monitor must also be named{{ serviceInstanceId }}, andServiceMonitormust be specified for service discovery. In this example, mysqld-exporter is used to query MySQL metrics. The following sample code provides examples ofServiceandServiceMonitor:apiVersion: v1 kind: Service metadata: name: {{ serviceInstanceId }} labels: io.mysql.service: {{ serviceInstanceId }} spec: selector: app: mysql ports: - protocol: TCP port: 3306 targetPort: 3306 name: mysql - protocol: TCP port: 9104 targetPort: 9104 name: mysql-exporter type: LoadBalancerapiVersion: monitoring.coreos.com/v1 kind: ServiceMonitor metadata: name: prometheus-service-monitor annotations: arms.prometheus.io/discovery: 'true' labels: prometheus-service-monitor: prometheus-service-monitor spec: selector: matchLabels: io.mysql.service: {{ serviceInstanceId }} namespaceSelector: matchNames: - {{ serviceInstanceId }} endpoints: - port: mysql-exporter scheme: http path: /metrics interval: 10s scrapeTimeout: 10s
Step 3: Configure the Grafana dashboard
Each service instance only supports one dashboard. If the service provider has multiple dashboards, the service provider must combine them into one dashboard. The dashboard must meet the following rule:
Specify a fixed global variable of the dashboard as the namespace, and the dashboard filters metrics of each application based on the namespace. Create the dashboard in Alibaba Cloud Managed Grafana and obtain the URL to the dashboard.
Step 4: Configure the product identifier and corresponding dashboard link
Before the multi-tenant fully managed service can use Managed Service for Prometheus capabilities provided by Compute Nest, specify the product identifier and dashboard information:
Specify the product identifier. The product identifier uniquely identifies a service in the monitoring system. The cn-mariadb product identifier is used for testing and shared by all services in the China (Hangzhou) and China (Hong Kong) regions.
NoteIf you need to obtain a unique product identifier for a service to be published, join the DingTalk group mentioned above for technical support.
Configure dashboard settings, which include the title and URL of the Grafana dashboard. Obtain the URL and title of the dashboard that you created in Step 3.
NoteYou must manually configure the dashboard settings. Join the DingTalk group for technical support.
The following figure shows the configurations of the sample Prometheus service that uses the
cn-mariadbproduct identifier.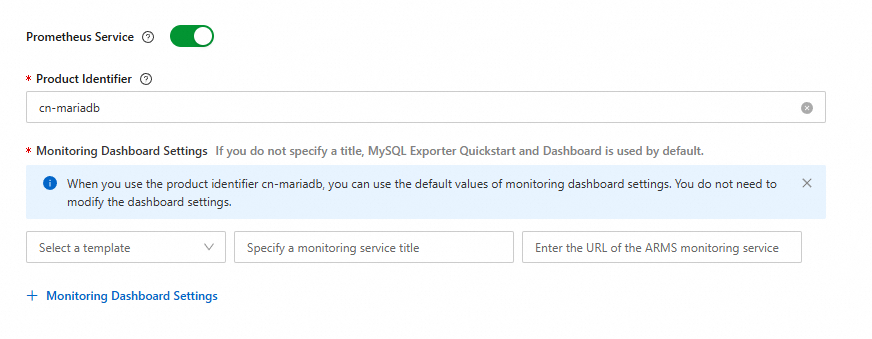
Step 5: Configure a Prometheus alert rule template
Log on to the Application Real-Time Monitoring Service (ARMS) console. On the Prometheus Alert Rule Templates page, create a Prometheus alert rule template. For more information, see Create and manage an alert rule template.
After creation, obtain the TemplateId value from the network response in the ARMS console, as shown in the following figure.
ImportantYou must change All Check Types to Static Threshold (area ①) in the upper-right corner, press the F12 key, and then obtain the TemplateId value from the field (area ②) in the network response.
Modify the alert rule template content in the ROS template. Apply the alert rule template to the ACK cluster by calling the ALIYUN::ARMS::ApplyAlertRuleTemplate operation to create corresponding alert rules in the ACK cluster. Sample ROS template:
ROSTemplateFormatVersion: '2015-09-01'
Description:
  en: ApplyAlertRule

Parameters:
  ClusterIds:
    AssociationPropertyMetadata:
      Parameter:
        Required: true
        Type: String
        Description:
          en: The ID of the Prometheus Instance.
    Description:
      en: The IDs list of Prometheus Instances.
    Default: Null
    MinLength: 1
    Required: false
    MaxLength: 100
    AssociationProperty: List[Parameter]
    Type: Json
  TemplateIds:
    AssociationPropertyMetadata:
      Parameter:
        Required: true
        Type: String
        Description:
          en: The ID of the Prometheus alert rule template.
    Description:
      en: The IDs list of Prometheus alert rule templates.
    Default: Null
    MinLength: 1
    Required: false
    MaxLength: 100
    AssociationProperty: List[Parameter]
    Type: Json
Resources:
  ApplyAlertRuleTemplate:
    Type: ALIYUN::ARMS::ApplyAlertRuleTemplate
    Properties:
      ClusterIds:
        Ref: ClusterIds
      TemplateIds:
        Ref: TemplateIds
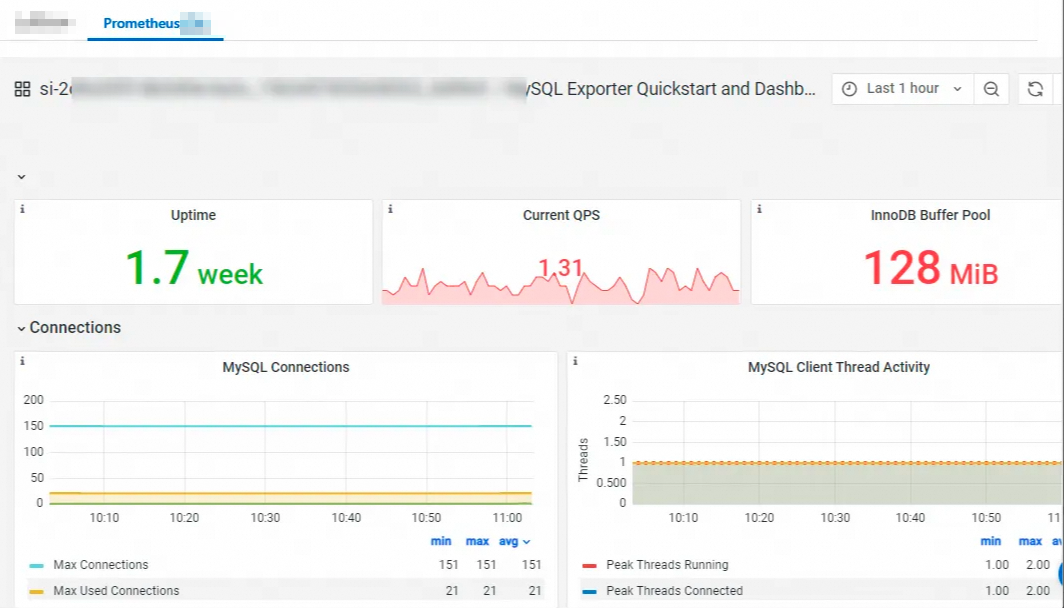
Step 6: View monitoring data
After the Prometheus service instance is deployed, you can view the dashboard on the service instance details page on the user side and the service provider side.
User side:
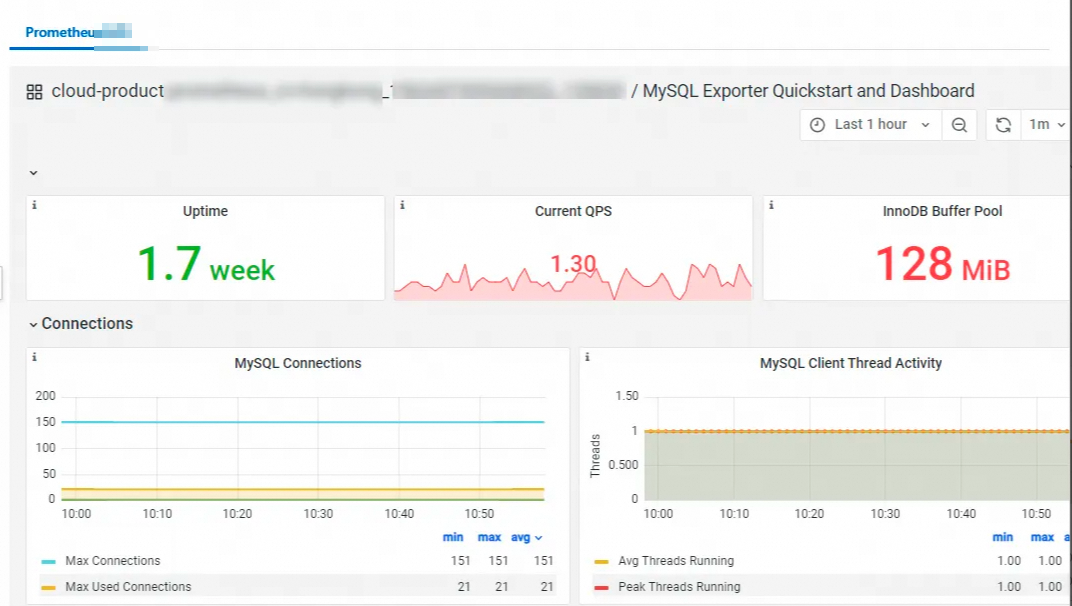
Service provider side: