Managed Service for Prometheus supports service discovery through the ServiceMonitor CRD. A ServiceMonitor defines the namespace scope for pod discovery and selects target Services using matchLabel. This topic walks through creating a ServiceMonitor-based service discovery for a Spring Boot application.
Demo
Download the demo project for a complete ServiceMonitor-based service discovery example.
Step 1: Add dependencies
-
Create a Maven application and add the following dependencies to the pom.xml file.
<dependencies> <dependency> <groupId>org.springframework.boot</groupId> <artifactId>spring-boot-starter-actuator</artifactId> </dependency> <dependency> <groupId>org.springframework.boot</groupId> <artifactId>spring-boot-starter-web</artifactId> </dependency> <dependency> <groupId>io.micrometer</groupId> <artifactId>micrometer-registry-prometheus</artifactId> <version>1.6.6</version> </dependency> <dependency> <groupId>org.springframework.boot</groupId> <artifactId>spring-boot-configuration-processor</artifactId> <optional>true</optional> </dependency> <dependency> <groupId>org.projectlombok</groupId> <artifactId>lombok</artifactId> <optional>true</optional> </dependency> <dependency> <groupId>org.springframework.boot</groupId> <artifactId>spring-boot-starter-test</artifactId> <scope>test</scope> </dependency> </dependencies> -
Add the following configuration to the src/resources/applications.properties file in the project.
management.endpoints.web.exposure.include=prometheus -
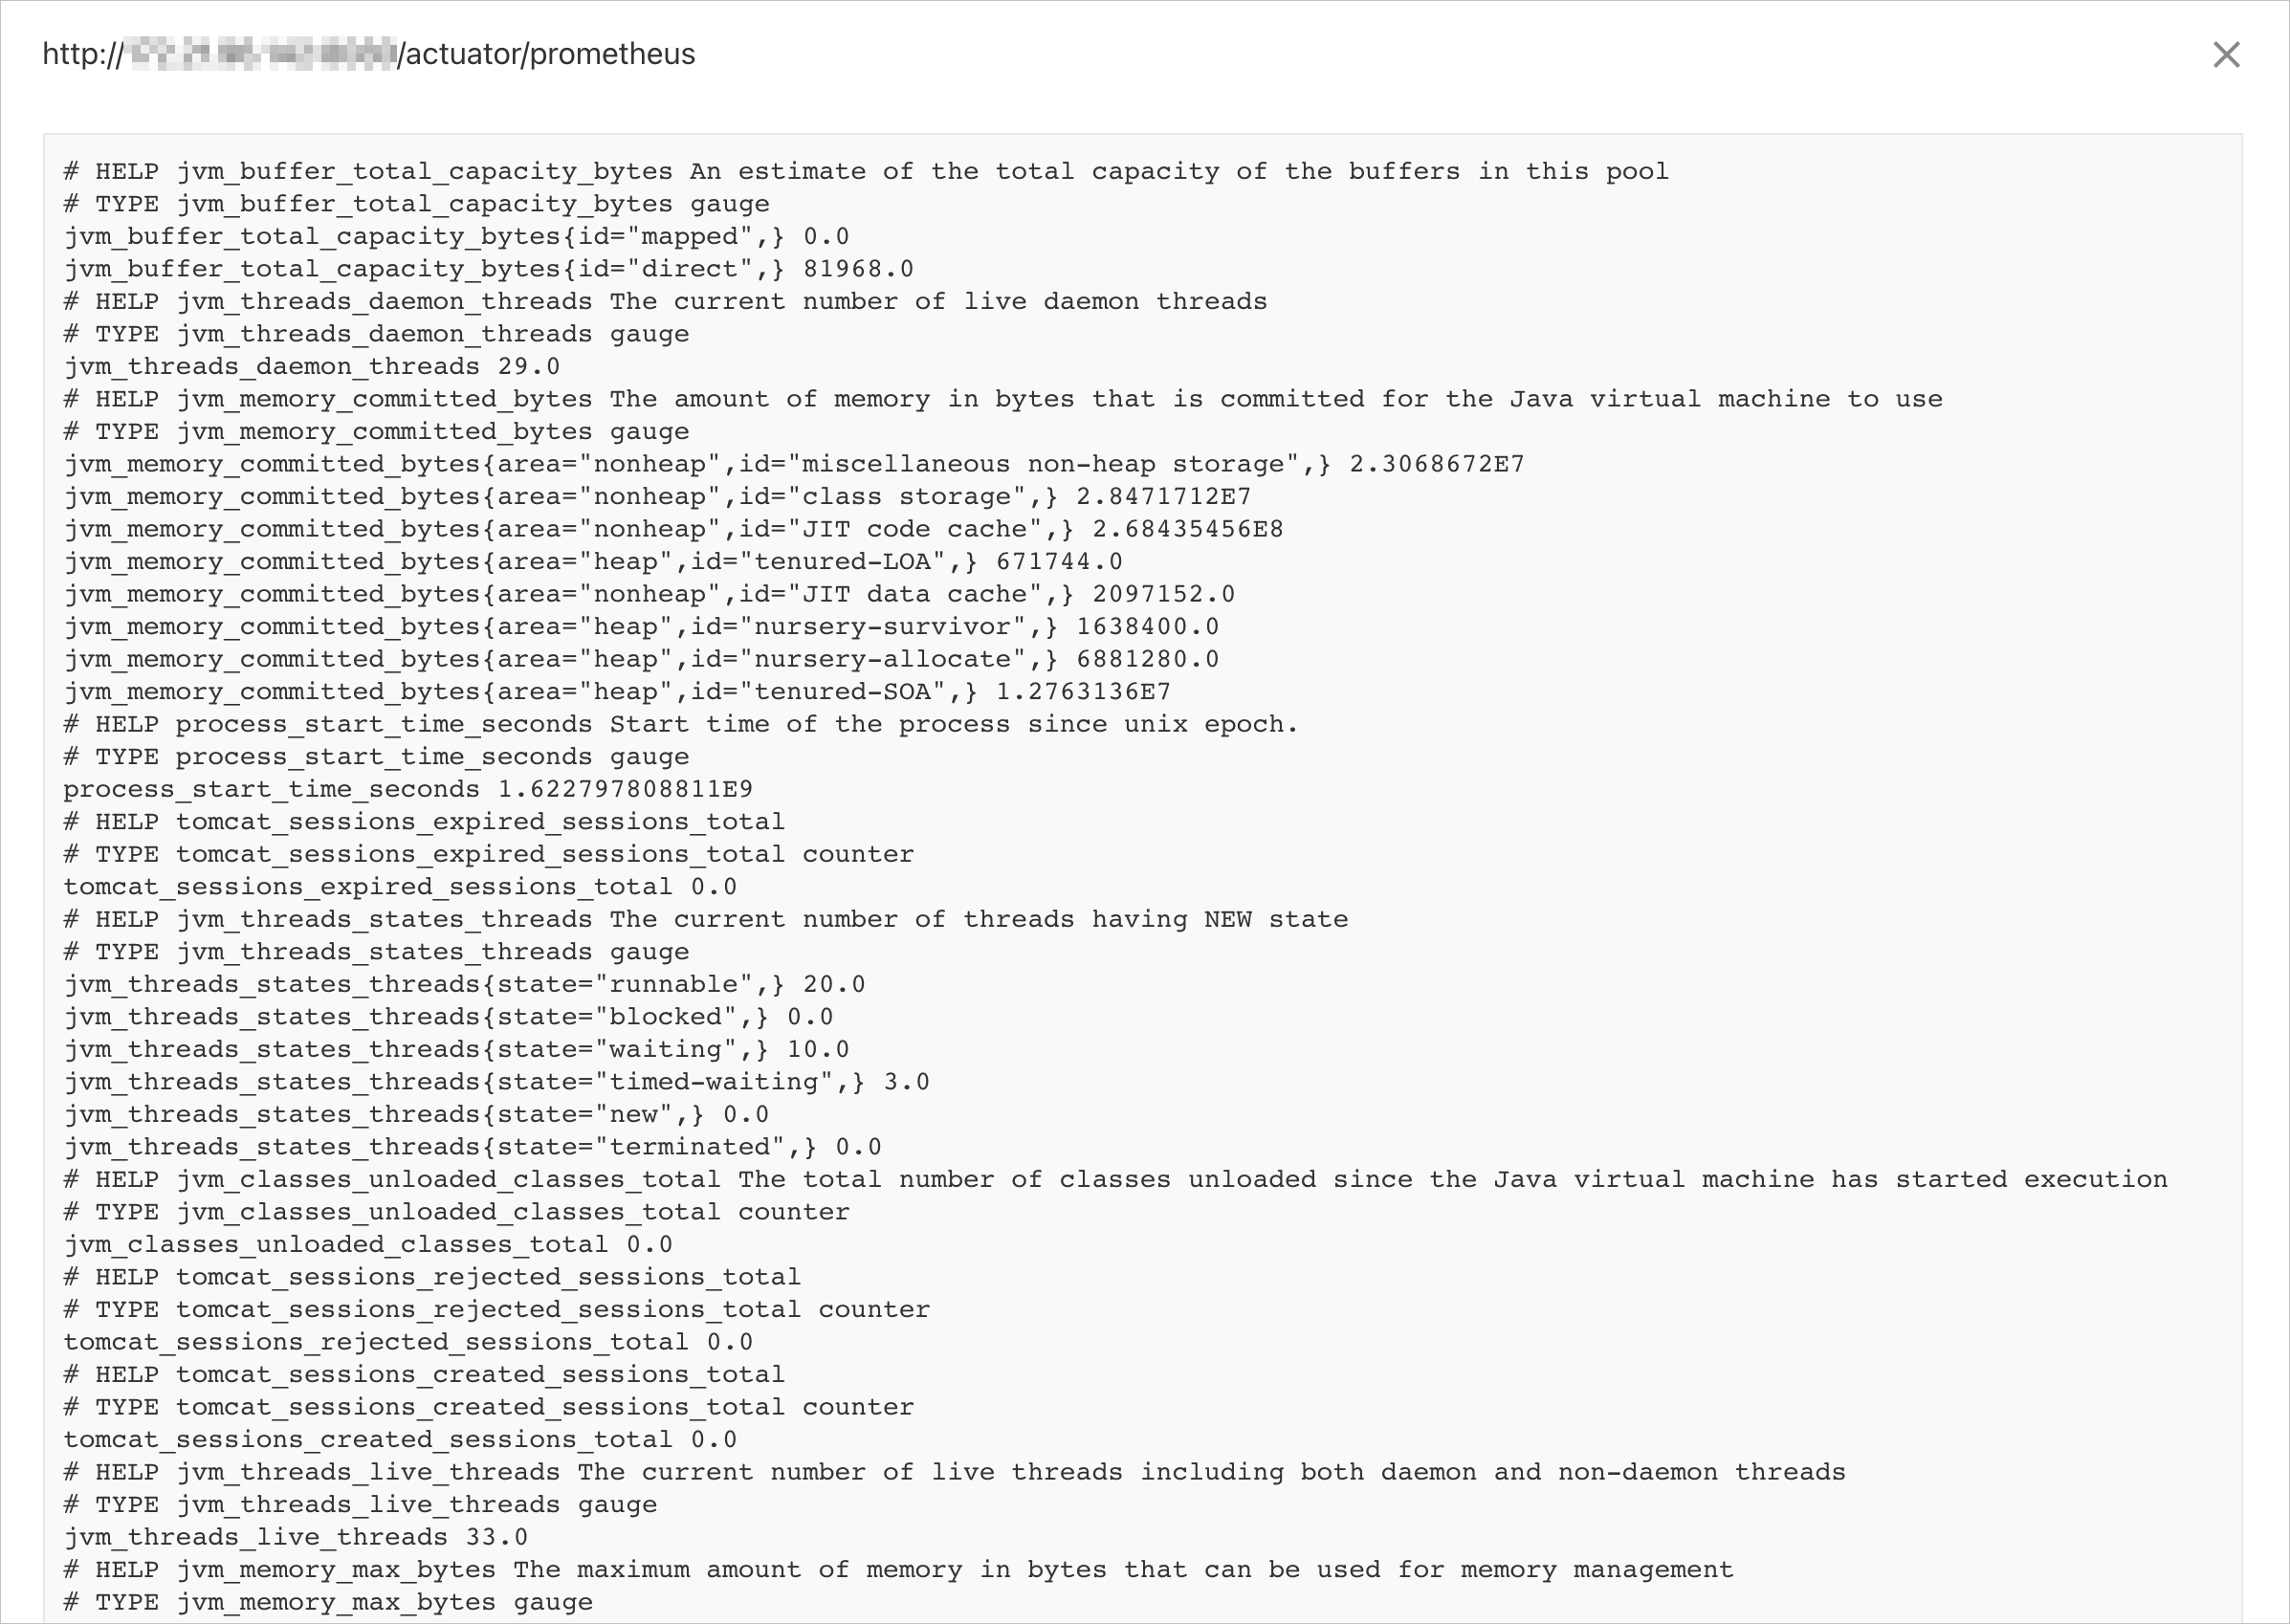
Start the project and access
http://{host}:{port}/actuator/prometheusin a browser.JVM monitoring data is displayed, as shown below.
Step 2: Deploy a Kubernetes cluster
-
Build an image and upload the image to an image repository. For more information, see Connect to a source code platform.
-
Create a deployment using the following YAML configuration.
apiVersion: apps/v1 kind: Deployment metadata: name: micrometer-prometheus namespace: default labels: app: demo-prometheus spec: replicas: 3 selector: matchLabels: app: demo-prometheus template: metadata: labels: app: demo-prometheus spec: containers: - name: micrometer-prometheus image: manjusakalza/micrometer-prometheus:latest ports: - containerPort: 8080 -
Create a Service using the following YAML configuration.
apiVersion: v1
kind: Service
metadata:
  name: prometheus-metrics-demo
  namespace: default
  labels:
    micrometer-prometheus-discovery: 'true'
spec:
  selector:
    app: demo-prometheus
  ports:
    - protocol: TCP
      port: 8080
      targetPort: 8080
      name: metrics
Step 3: Create a ServiceMonitor
-
Save the YAML file to your computer and run
kubectl apply -f {path/to/the/YAML/file}to apply the file.
Sample ServiceMonitor YAML:
apiVersion: monitoring.coreos.com/v1
kind: ServiceMonitor
metadata:
  name: micrometer-demo
  namespace: default
spec:
  endpoints:
    - interval: 15s
      path: /actuator/prometheus
      port: metrics    # Note: Configure the port name, not the port number.
  namespaceSelector:
    any: true
  selector:
    matchLabels:
      micrometer-prometheus-discovery: 'true'
YAML field descriptions:
-
The
metadatafieldsnameandnamespaceidentify the ServiceMonitor. -
The
specfieldendpointsdefines the scrape targets. Eachendpointin theendpointsarray (endpointssupports multiple entries) contains these fields:-
interval: Scrape interval for thisendpoint. Example:15s. -
path: Metrics scrape path. Example:/actuator/prometheus. -
port: Service port name (must match thenamedefined in your Service from Step 2). Example:metrics.ImportantConfigure the port name, not the port number.
-
-
The
specfieldnamespaceSelectorsets the Service discovery scope.namespaceSelectorsupports two mutually exclusive fields:-
any: Set totrueto monitor all matching Services across all namespaces. -
matchNames: Limits monitoring to specificnamespaces. For example, to monitor only the default and arms-prom namespaces, setmatchNamesas follows:namespaceSelector: matchNames: - default - arms-prom
-
-
The
specfieldselectorfilters Services by label.The example Service has the label micrometer-prometheus-discovery: 'true', so configure
selectoras follows:selector: matchLabels: micrometer-prometheus-discovery: 'true'
To enable basic auth, use the following YAML:
apiVersion: monitoring.coreos.com/v1
kind: ServiceMonitor
metadata:
  name: cloud-open-api-monitor     #  Set a unique name for the ServiceMonitor.
  namespace: default   #  Set the namespace where the ServiceMonitor resides.
spec:
  endpoints:
  - interval: 30s
    # Specify the interval at which Prometheus scrapes the current endpoint.
    port: tcp-8080
    # Enter the path exposed in the Prometheus exporter code.
    path: /api/actuator/prometheus
    basicAuth:
      password:
        name: basic-auth
        key: <password>
      username:
        name: basic-auth
        key: <userName>
    scheme: http
  namespaceSelector:
    any: true
  selector:
    matchLabels:
      # Match Services with the following label.
      edas.oam.acname: cloud-open-api
If you lack permissions for basic auth, create a ClusterRole with the required permissions and bind it to the ServiceAccount arms-prom-operator in the arms-prom namespace via a ClusterRoleBinding.
-
ClusterRole YAML file
apiVersion: rbac.authorization.k8s.io/v1 kind: ClusterRole metadata: name: prometheus-agent-role labels: app: prometheus-agent rules: - apiGroups: [""] resources: ["pods", "services", "endpoints", "nodes"] verbs: ["get", "list", "watch"] # Adjust as needed. - apiGroups: ["monitoring.coreos.com"] # Adjust the apiGroups as needed. resources: ["*"] verbs: ["get", "list", "watch", "create", "update", "delete"] # Adjust as needed. -
ClusterRoleBinding YAML file
apiVersion: rbac.authorization.k8s.io/v1
kind: ClusterRoleBinding
metadata:
  name: prometheus-agent-binding
subjects:
  - kind: ServiceAccount
    name: arms-prom-operator  # Service account name
    namespace: arms-prom      # The namespace where the service account resides.
roleRef:
  kind: ClusterRole
  name: prometheus-agent-role  # The name of the ClusterRole defined above.
  apiGroup: rbac.authorization.k8s.io
Step 4: Verify the ServiceMonitor
Verify that Prometheus discovers your service:
Log on to the Managed Service for Prometheus console. In the left-side navigation pane, click Integration Management.
-
On the Integrated Environments tab, click the name of the target container environment in the Container Service list.
-
Click the Self-Monitoring tab.
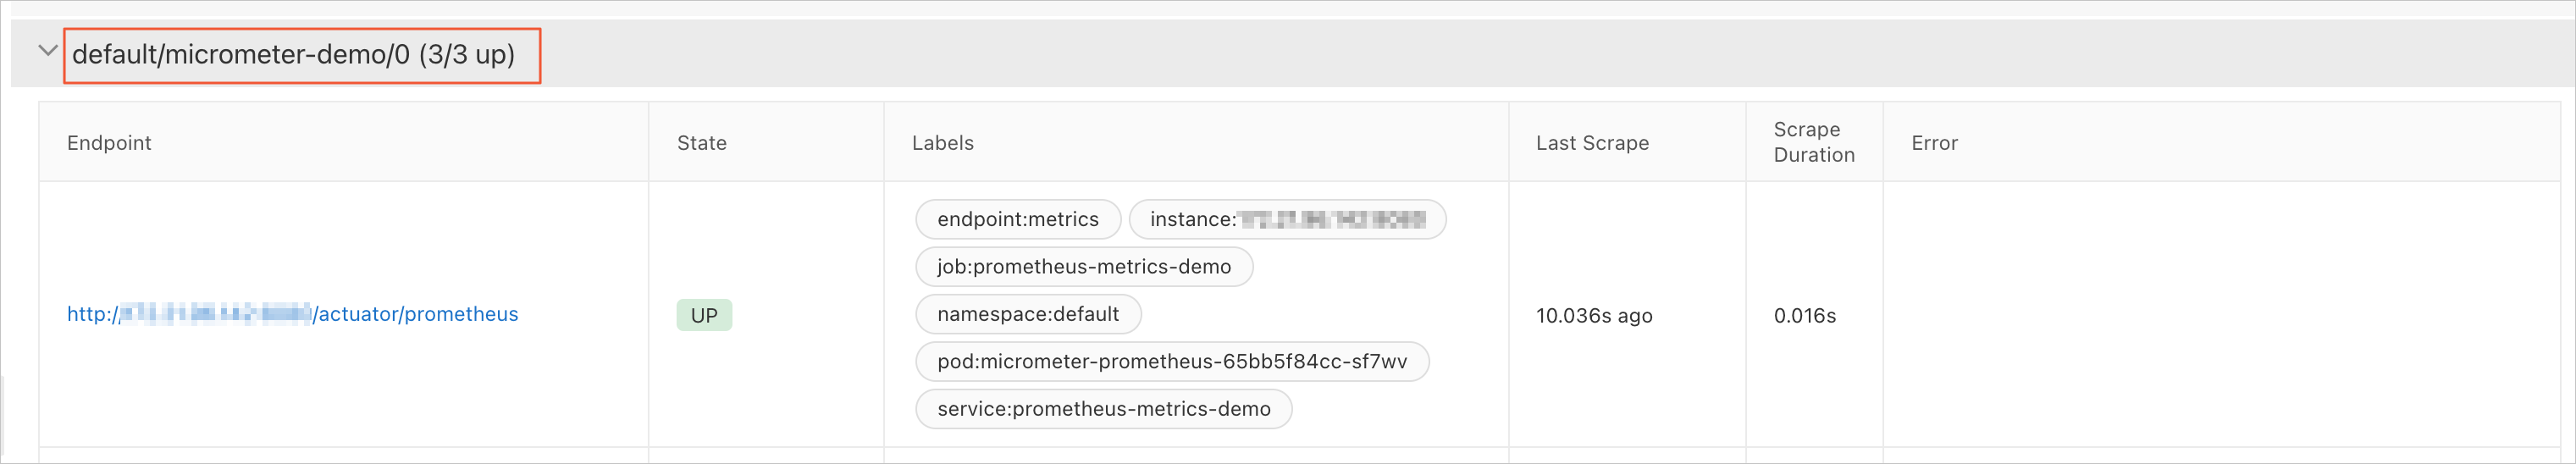
On the Targets tab, check whether a target named {namespace}/{serviceMonitorName}/x exists.
-
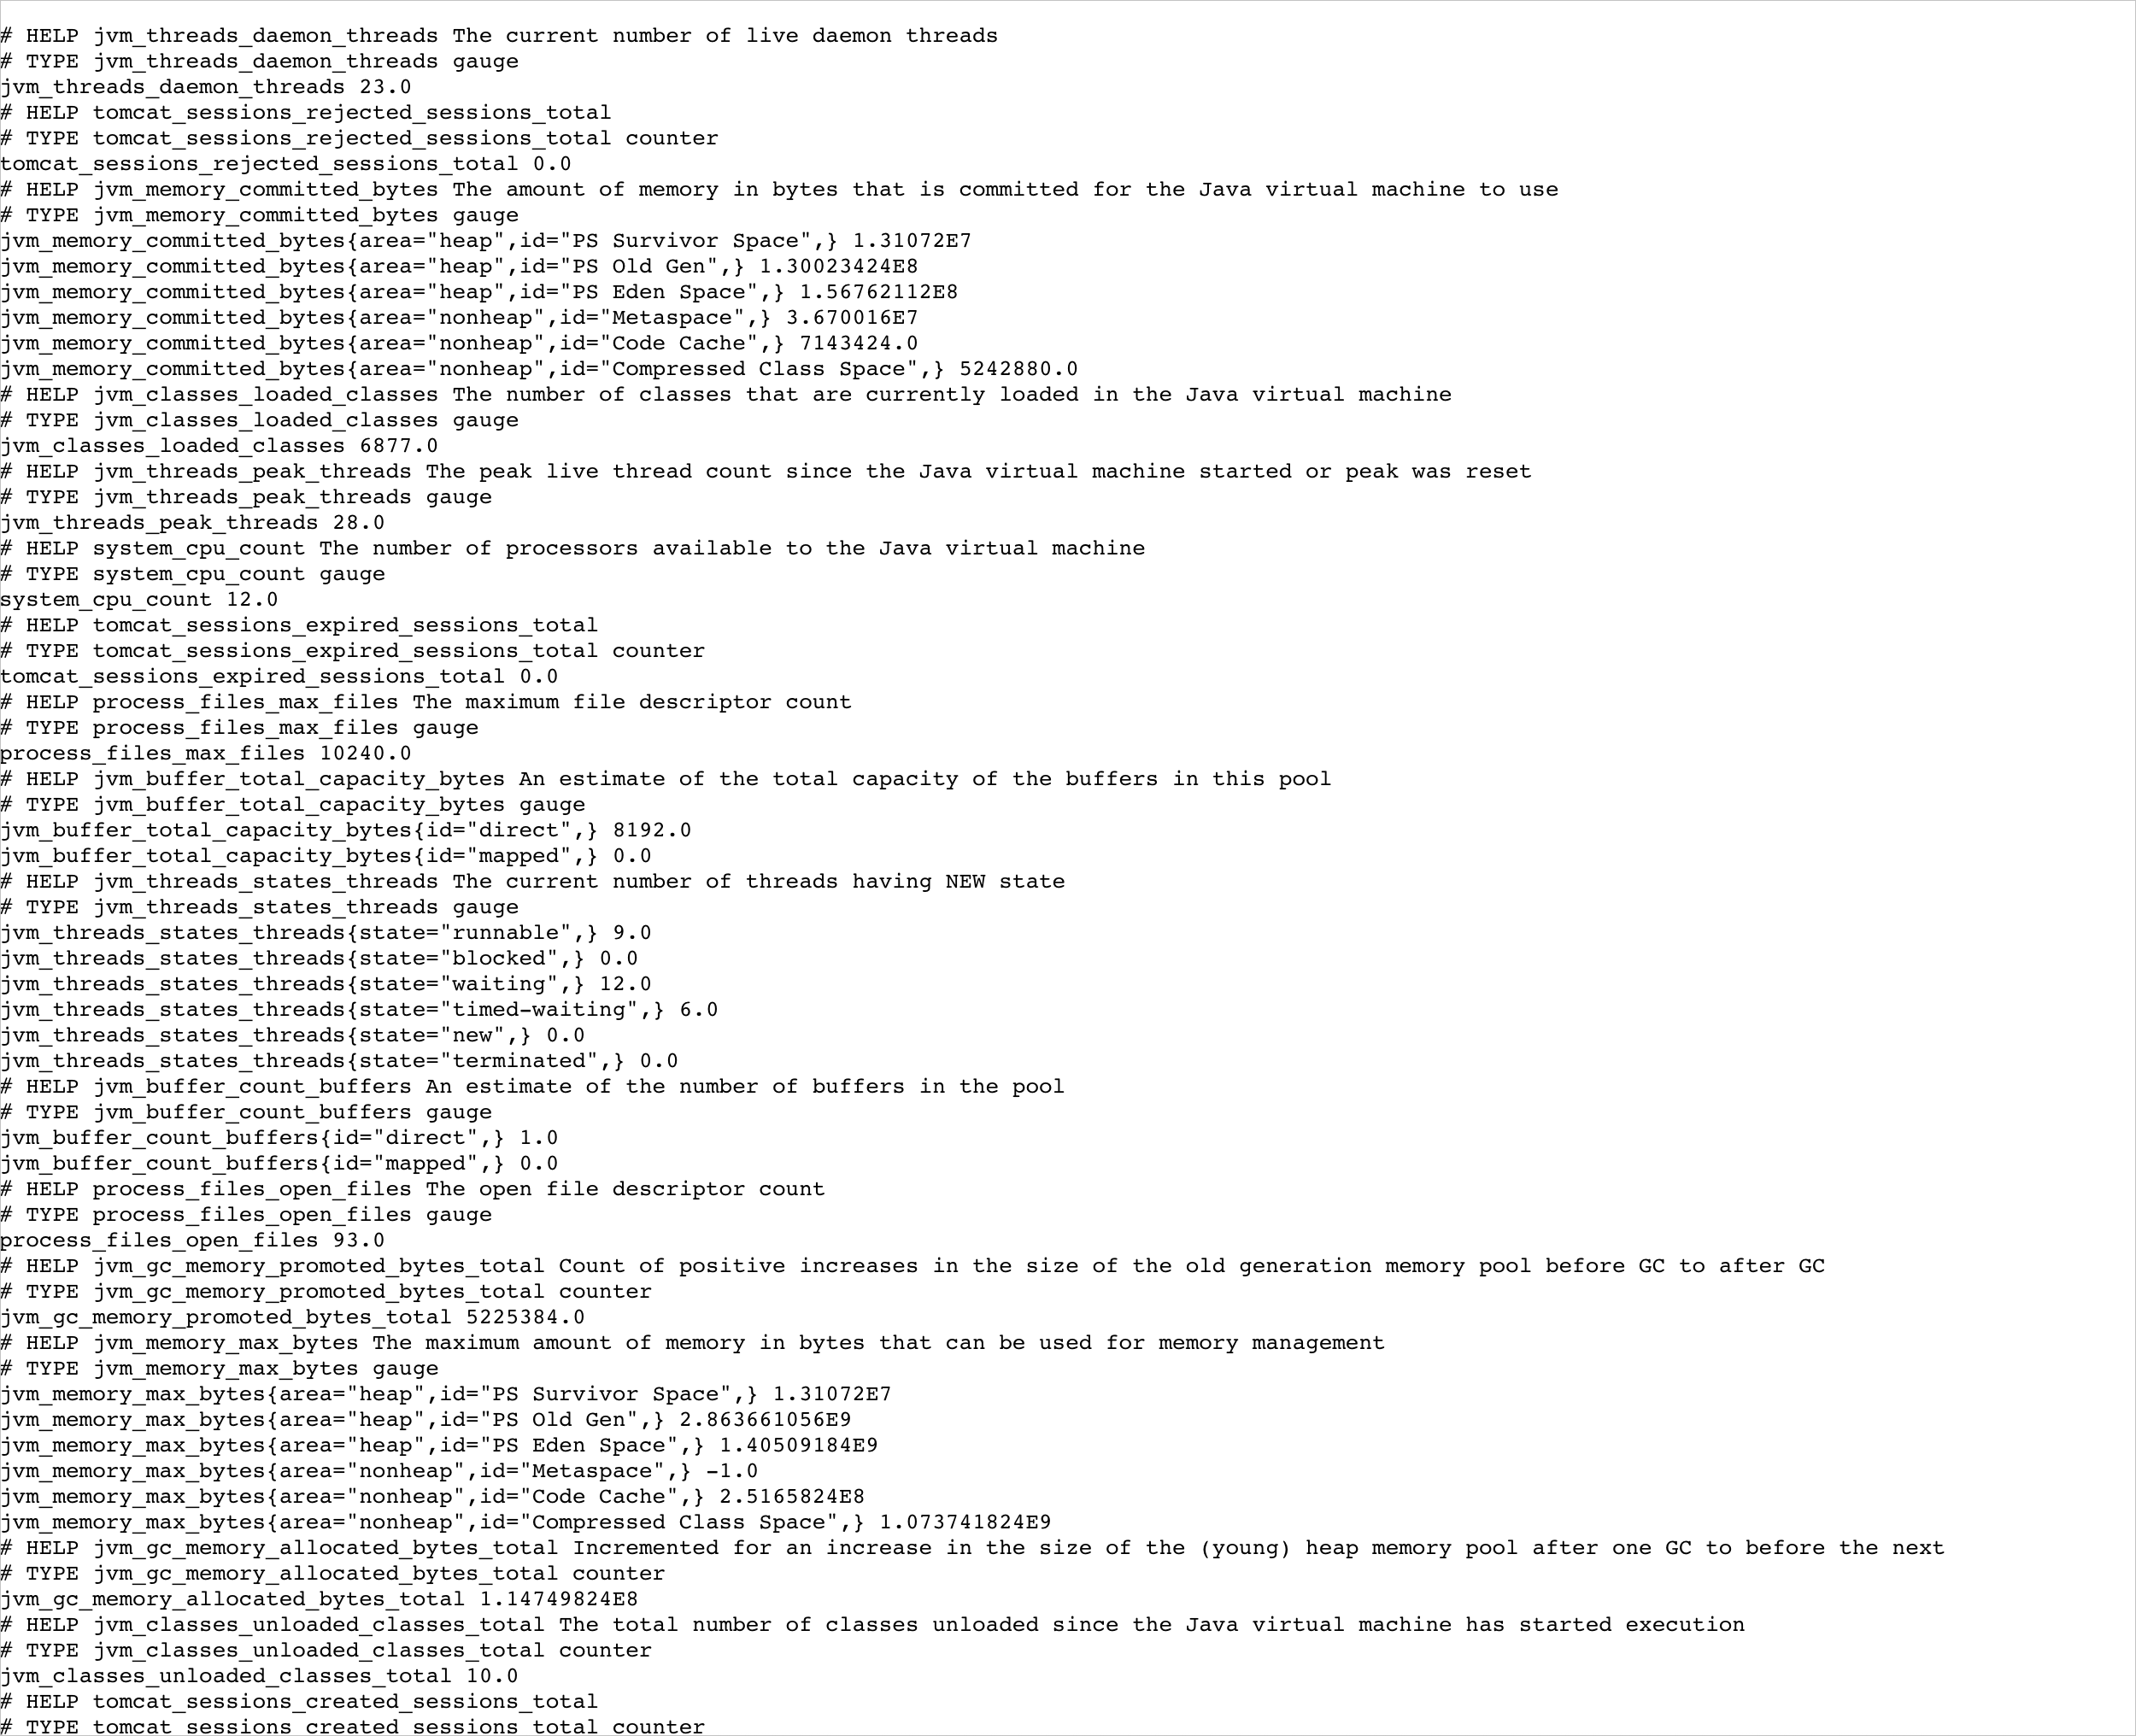
Expand the {namespace}/{serviceMonitorName}/x target row and click the endpoint link.
Verify that metrics display correctly.