The Trace Explorer feature in Application Monitoring enables real-time analysis of all stored trace data. You can combine filter conditions and aggregation dimensions to meet custom diagnostic needs for various scenarios.
Prerequisite
An agent is installed for the application.
Experience the feature
Alibaba Cloud Playground provides a demo environment where you can experience the main features of Cloud Monitor 2.0.
Go to the Playground demo environment. The default workspace is
o11y-demo-cn-hangzhou.In the navigation pane on the left, navigate to .
Filter traces
Log on to the Cloud Monitor 2.0 console, and select a workspace. In the left navigation pane, choose .
On the Application List page, click the name of the target application. Then, in the top navigation bar, click Trace Explorer.
In the upper-right corner of the Trace Explorer page, select a time range that you want to query.
Filter traces.
In the Quick Filter area on the left, filter traces by status, duration, application name, interface name, and host address.
The filter conditions are displayed in the text box at the top of the page.
Click the text box at the top of the page. From the drop-down list, you can modify the filter conditions or set filter conditions for other dimensions.
You can also enter a query condition directly in the text box at the top. For more information about the query syntax, see Query syntax for Trace Explorer.
- Note
Select an aggregation dimension to group the filtered data.
Click the
 icon to the right of the text box to save the current filter conditions.
Click Saved Views to the right of the text box to view saved filter conditions. You can then click a filter condition to quickly view the trace information that matches it.
Trace list
After you configure the filters, the Trace Explorer page displays the filtered trace information. This information includes a column chart of the number of calls and HTTP errors, a time-series curve of call latency, and the Span List and Trace List.
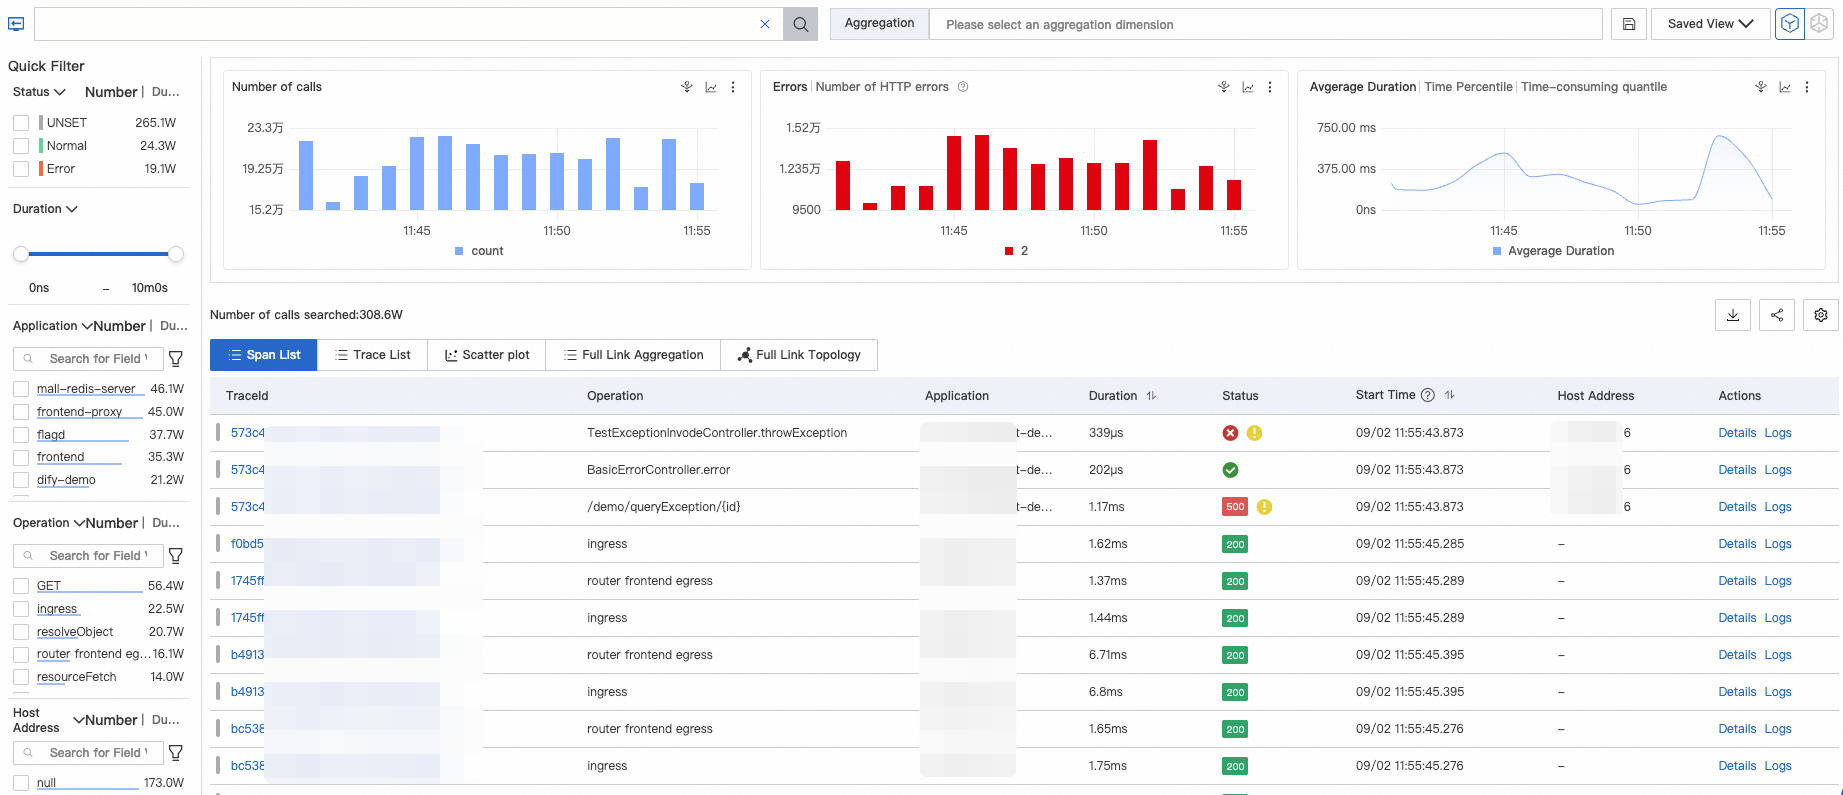
The following table describes the icons in the Status column of the list.
 : Indicates that the span status is Normal. This icon is displayed when the value of the
 statusCodefield is 0 (not set) or 1 (Normal). : Indicates that the span status is Error. This icon is displayed when the value of the
 statusCodefield is 2. : Indicates that the span contains an exception. This icon is displayed when the
 attributes.excep.idsfield is not empty.2XX (green), 3XX (yellow), 4XX (orange), and 5XX (red): HTTP status codes. The status code is retrieved from the
attributes.http.status_codeorattributes.http.response.status_codefield of the span. If a span contains these fields, the HTTP status code takes precedence over the Normal or Error status.
The following table describes the colored bars to the left of the TraceIds.
 : Indicates that the statusCode of the span is 0.
 : Indicates that the statusCode of the span is 1.
 : Indicates that the statusCode of the span is 2.
In the Span List and Trace List areas, you can perform the following operations:
Click the TraceId of a trace or click Details in the Actions column to view the trace details and topology. For more information, see Trace details.
Click Log in the Actions column of a trace to view the log information that corresponds to the trace. For more information, see Log analysis.
By default, the root span is displayed for each TraceId in the Trace List. Click the
 icon to expand and view all spans under the TraceId.
Click the
 icon in the upper-right corner to add or hide parameters in the list.
Hover the mouse pointer over a trace parameter and click the
 icon that appears on the right to add the current parameter value as a filter condition.
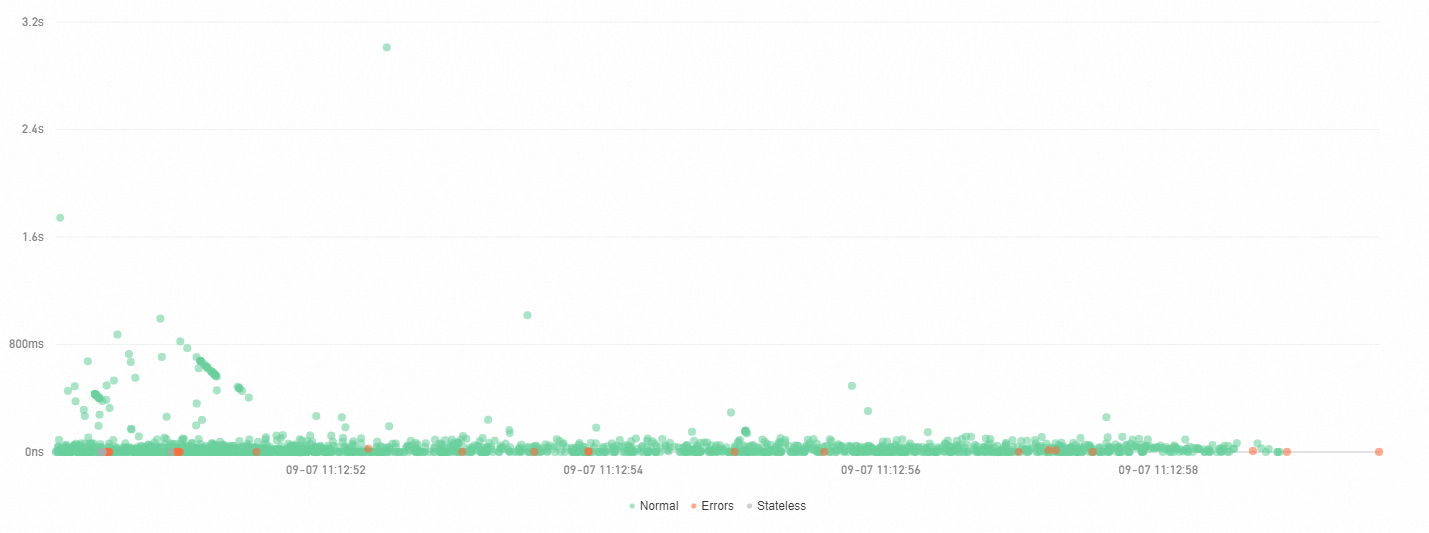
Scatter chart
On the Scatter Chart page, the horizontal axis represents time and the vertical axis represents latency. The chart shows the latency distribution of traces. You can hover the mouse pointer over a point to view basic information about the corresponding trace. Click a point to view the details of the trace.
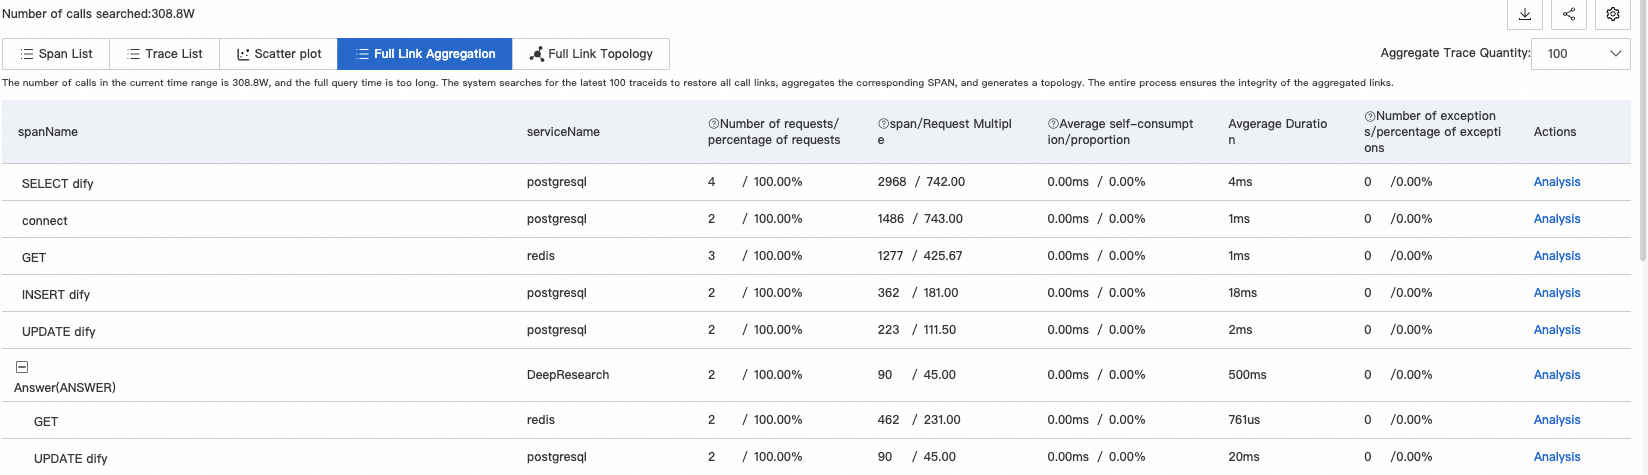
Full link aggregation
Trace analysis lets you analyze queried spans by various dimensions. However, this analysis is performed on individual spans, not at the trace level. The full link aggregation feature lets you query the TraceIds of distributed traces based on specified conditions, up to 5,000 TraceIds. You can then query the corresponding spans based on these TraceIds and aggregate the spans to retrieve the final result. This process ensures the integrity of the aggregated traces.
Full link aggregation calculates and aggregates data based on your query conditions. If you select many conditions, the query and calculation may take some time.
Parameter | Description |
spanName | The name of the span. |
serviceName | The name of the application to which the span belongs. |
Number of requests/Request percentage | Request percentage: The percentage of requests that invoke the current span node. For example, 10% indicates that 10% of requests invoke the current span. Formula: Request percentage = (Number of requests for the current span / Total number of requests) × 100% |
Number of spans/Request multiplier | Request multiplier: The average number of times the current span is invoked per request. For example, 1.5 indicates that each request invokes the current span 1.5 times. Formula: Request multiplier = Number of spans / Number of requests for the span |
Average self duration/Percentage | Average self duration: The duration of a span, excluding the duration of its child spans. For example, for Span A and its child Span B, if the duration of A is 10 ms and the duration of B is 8 ms, the self duration of A is 2 ms. Formula: Self duration = Span duration - Total duration of all child spans Important For asynchronous invocations, the self duration is the same as the span duration. You do not need to subtract the duration of child spans. |
Average duration | The average duration of the span. |
Number of exceptions/Exception percentage | Exception percentage: The percentage of requests that have exceptions. For example, 3% indicates that 3% of requests have exceptions. Formula: Exception percentage = Number of exceptional requests / Total number of requests Important The number of exceptional requests is not equal to the number of exceptions, which is the number of times a span invocation is exceptional. If the request multiplier is greater than 1, one exceptional request may correspond to multiple exceptions. |
Analysis | Adds the current spanName and serviceName to the filter conditions to query the corresponding traces. |
Example: In the following table, Span A invokes Span B and Span C. The parameters are described as follows.
spanName | serviceName | Number of requests/Request percentage | Number of spans/Request multiplier | Average self duration/Percentage | Average duration | Number of exceptions/Exception percentage | |
A | - | demo | 10/100.00% | 10/1.00 | 5.00ms/25.00% | 20ms | 2/20.00% |
- | B | demo | 4/40.00% | 8/2.00 | 16.00ms/100.00% | 16ms | 2/50.00% |
- | C | demo | 1/10.00% | 1/1.00 | 4.00ms/100.00% | 4ms | 1/100.00% |
For the entry span A, the Number of requests/Request percentage is 10/100.00%. This indicates that the total number of requests for A is 10, representing 100% of the total. For B, the Number of requests/Request percentage is 4/40.00%, which indicates that only 4 requests invoked B. Similarly, only 1 request invoked C. The corresponding request percentages are 40% and 10%. The remaining requests may not have invoked B or C because of logical judgments or exceptions. This data reflects the distribution of requests.
For A, the Number of spans/Request multiplier is 10/1.00. This indicates that each request invoked A only once. However, for B, 8 spans were generated from 4 requests, meaning each request invoked B twice. This reflects the distribution of spans within a single request.
For A, the Average self duration/Percentage is 5.00 ms/25.00%. This indicates that the average duration of A, excluding B and C, is 5 ms, which accounts for only 25% of the total average duration. For child spans B and C, because they have no child spans, their self duration is the same as their total duration. This reflects the distribution of duration.
For A, the Number of exceptions/Exception percentage is 2/20.00%. This indicates that A had 2 exceptions, accounting for 20% of the total requests. For B, the Number of exceptions/Exception percentage is 2/50.00%. Because a total of 4 requests invoked B, an exception percentage of 50% means that 2 of those requests had exceptions. A possible distribution for B is that out of 4 total requests, 2 requests invoked 4 normal B spans. In the other 2 requests, the first invocation of Span B failed, and the subsequent re-invocation succeeded.
To view the details of a specific trace, hover the mouse pointer over the blue span name. In the tooltip that appears, the recommended trace ID is displayed. Click the TraceId to view the details.
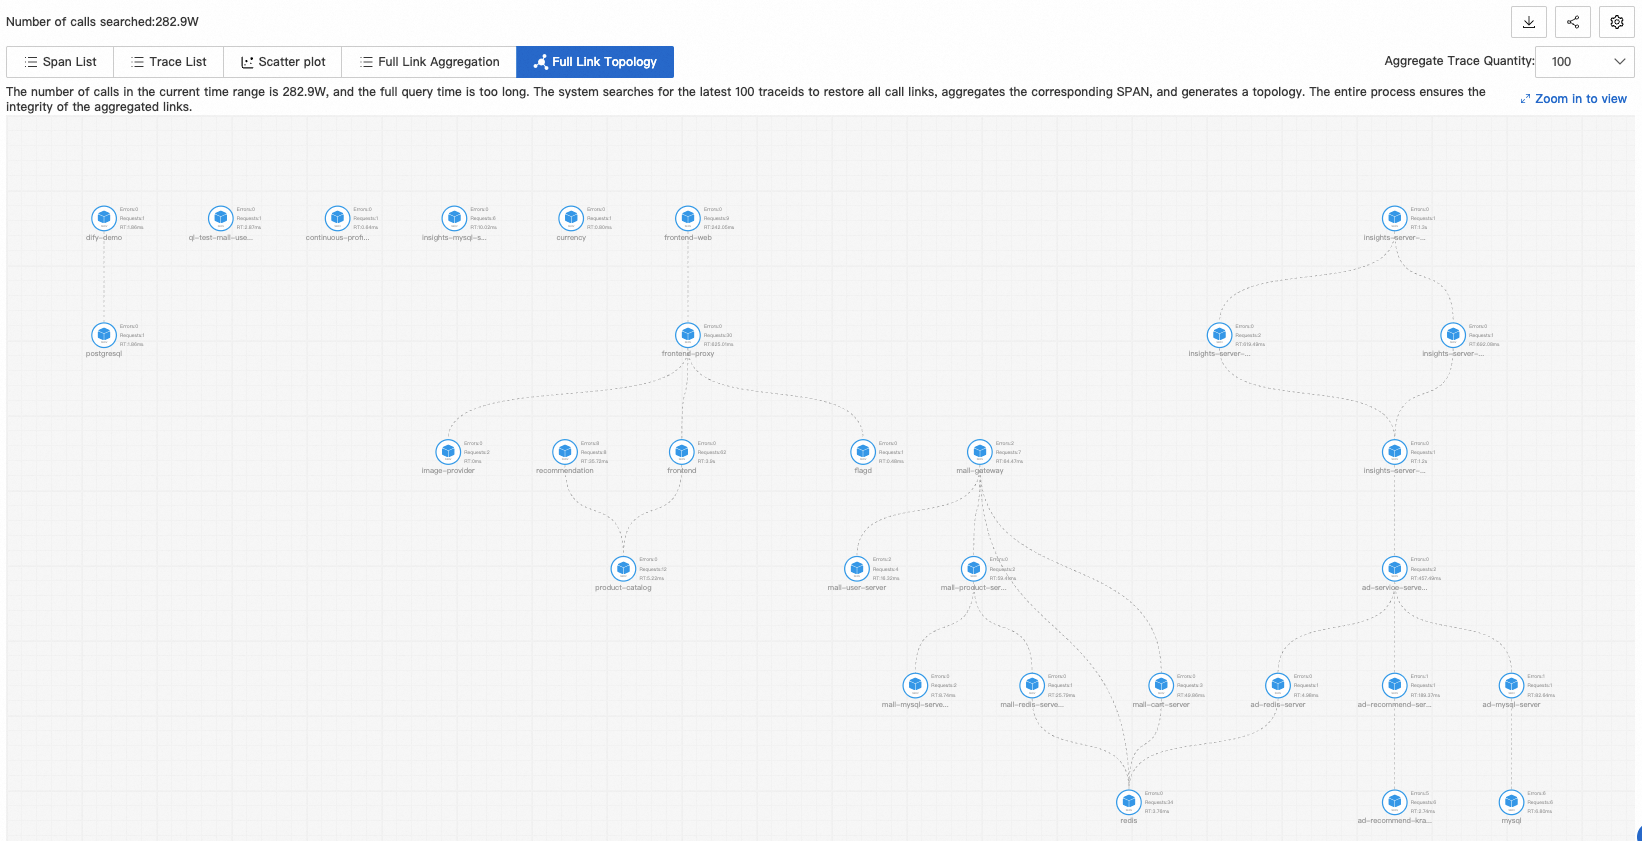
Full link topology
The Full Link Topology tab displays the inter-application topology after trace aggregation. As shown in the following figure, the call relationship between two applications is displayed. The chart also displays data such as the number of requests, number of errors, and response time.
Trace details

Component labels (① in the figure)
The labels show the invocation type and the number of spans of that type in the trace.
The invocation type is determined by the component.name in the span attributes (attributes.component.name).
Click a component label to hide spans of the corresponding type in the trace. This helps you filter out spans that you do not need to focus on. Click the label again to display the spans.
Trace trail map (② in the figure)
The trace trail map displays the entire trace link and the distribution of span data.
Each bar in the trace trail map represents a span. Only spans whose duration accounts for more than 1% of the total duration are displayed.
Different applications are distinguished by different colors. For example, in the preceding figure, blue represents the opentelemetry-demo-adservice application.
The length of the black line in the trail map represents the self duration of the span. Self duration is calculated as the span duration minus the sum of the durations of its child spans. For example, if Span A invokes Span B, the duration of A is 10 ms, and the duration of B is 8 ms, the self duration of A is 2 ms.
The timeline represents the time span of the entire trace data.
Focus and filter traces (③ in the figure)
Each row in this area represents a span and shows the hierarchical relationship between parent and child spans. The number before a span indicates the number of child spans it has. In this area, you can perform the following operations:
Collapse: Click the
 icon to collapse or expand a span.
Focus: Select a target span and click the
 icon. The system displays only that span and its downstream data.
Unfocus: Click the
 icon to cancel the focus on the span.
Filter: In the search box, enter information contained in the target span, such as the span name, application name, or attributes. This filters the view to the target span and displays the call path from the entry span to the target span. To cancel the filter, delete the content in the search box and click Search.
Zoom in and out: Click the
 icon to zoom in on the trace and hide the trace trail map. Click the
  icon to restore the trace trail map.
Span details (④ in the figure)
The Span Details area contains detailed information about the current span, associated metrics, logs, and exception information. You can also manage and trigger custom interactive events.
Additional Information: This section contains four types of information grouped by type: Attributes, Resources, Details, and Events. For more information about the fields in the span details, see Parameters for Trace Explorer.
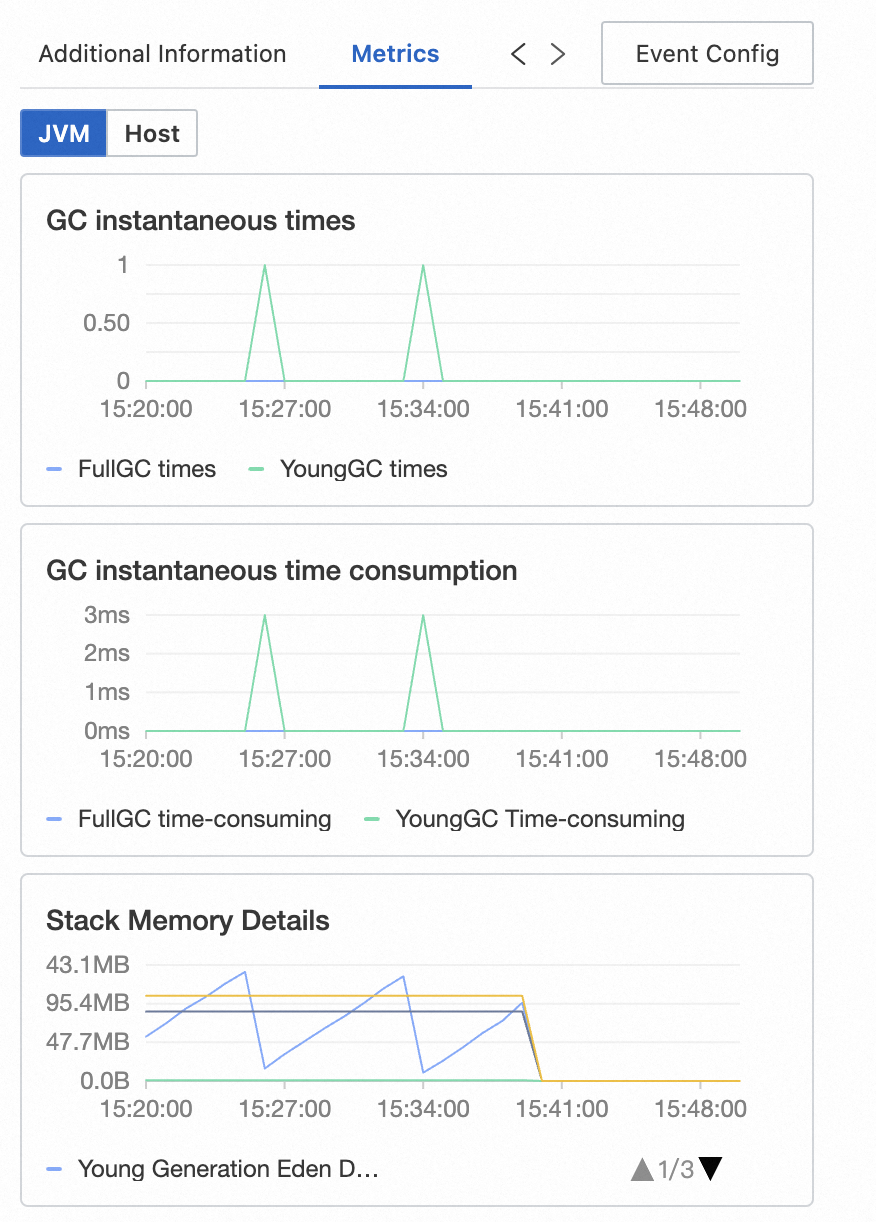
Metrics: Displays metrics associated with the span. For traces of ARMS Java applications, metrics for the JVM and host dimensions are displayed. For traces reported by open-source probes, the three golden signals (Rate, Errors, and Duration) are displayed.
Log Correlation: If you have associated a Simple Log Service Logstore with your application, you can quickly navigate to the Logstore to query business logs that correspond to the current TraceId.
Exceptions: If a span records exception information, the specific exception details are displayed here.
Event Configuration: You can set interactive events for one or more attributes of a trace. This makes it easier to query more detailed traces or view associated information such as logs and metrics. For more information about how to configure custom interactive events, see Configure custom interactive events for traces.