The log analysis feature allows you to analyze the logs collected by Simple Log Service or Cloud Monitor 2.0 to accurately identify service exceptions that occur to your application. This topic describes how to enable this feature and analyze the logs collected by Simple Log Service.
Prerequisites
You have installed an agent for the application.
You have activated Simple Log Service. If it is not activated, log on to the Simple Log Service console and activate it as prompted.
You have created a project and a Logstore, and configured data collection for Simple Log Service.
Try in Playground
Alibaba Cloud Playground provides a demo environment where you can experience the main features of Cloud Monitor 2.0.
Visit the Playground demo environment. By default, you are logged on to the
o11y-demo-cn-hangzhouworkspace.In the left navigation pane, choose .
On the Applications page, click an application. Then, click Trace Analysis.
Step 1: Associate business logs with Trace IDs
Log on to the Cloud Monitor 2.0 console, and select a workspace. In the left navigation pane, choose .
On the Applications page, click an application. Then, choose .
In the Application Log Association section, turn on the Associate Business Logs with Trace ID switch, select the region where your Simple Log Service project is located, and associate the project with the Logstore.
In the lower-left corner of the tab page, click Save.
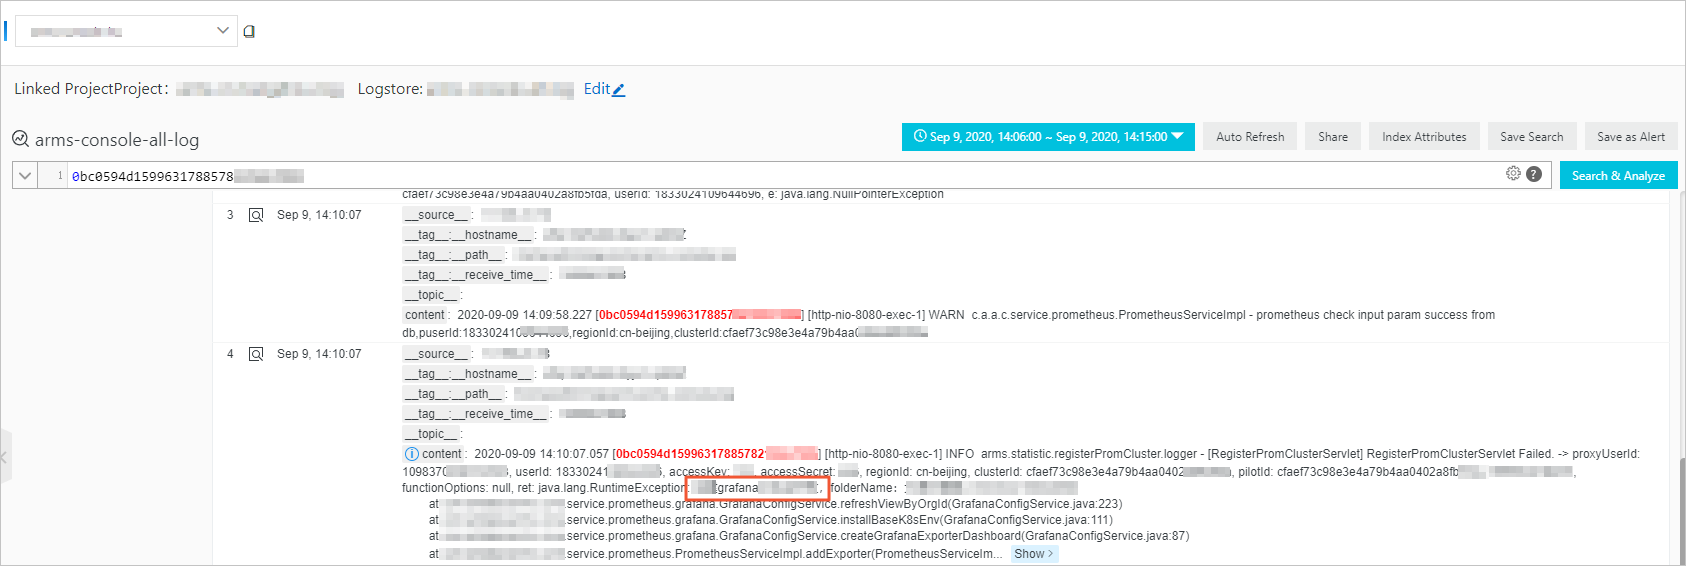
Step 2: Query and analyze logs
Log on to the Cloud Monitor 2.0 console, and select a workspace. In the left navigation pane, choose .
On the Applications page, click an application. Then, click Trace Analysis.
In the Actions column of the trace, click Logs.
On the log query page, perform the following operations:
In the search box, enter a query analysis statement.
A query analysis statement consists of a query statement and an analytic statement. Format: Query statement|Analytic statement. For more information about the syntax of a query analysis statement, see Query syntax and functions and Aggregate functions.
Specify a time period for query.
You can set a custom time period by specifying the start time and end time. The start time and end time can be in hours or accurate to the second. You can also set a time length without specifying the start time or end time.
NoteThe query results may contain logs generated 1 minute earlier or later than the specified time period.
Click Query/Analyze to view the query analysis results.
Related step
Associate trace IDs with application logs for error identification and troubleshooting.