After you install a probe for an application, Cloud Monitor 2.0 starts monitoring it. On the Application list page, you can view basic metrics for the application, such as request count, error rate, and response time.
Try the feature
Alibaba Cloud Playground provides a demo environment where you can experience the main features of Cloud Monitor 2.0.
Go to the Playground Demo. The workspace page is displayed by default.
In the navigation pane on the left, choose .
Page description
Log on to the Cloud Monitor 2.0 console, and select a workspace. In the left navigation pane, choose .
The Application list page shows basic metrics for all connected applications, such as average request count, average error count, and average latency.
At the top of the page, you can filter applications by a query condition or keyword.
Click an application name to view its details and configure custom settings.
Hover over a parameter in the list to perform quick operations.
 : Preview entity. View basic information about the entity in the panel that appears.
 : Send to Copilot. Use the AIOps Agent to analyze issues related to the current parameter.
 : Copy the current parameter name.
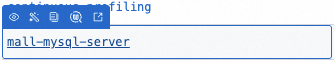
 : Quickly view information about entities associated with the current application, such as K8s pods, interfaces, and instances.
 : Open the link for the current parameter to view more detailed information.
FAQ
Why do duplicate application names appear?
Duplicate application names usually occur in the following two scenarios:
Two applications from different sources use the same name. For example, an application integrated through a product such as EDAS or SAE has the same name as an application that was manually connected to ARMS.
Two applications that use different language frameworks have the same name.
A RAM user cannot see applications on the Application list page
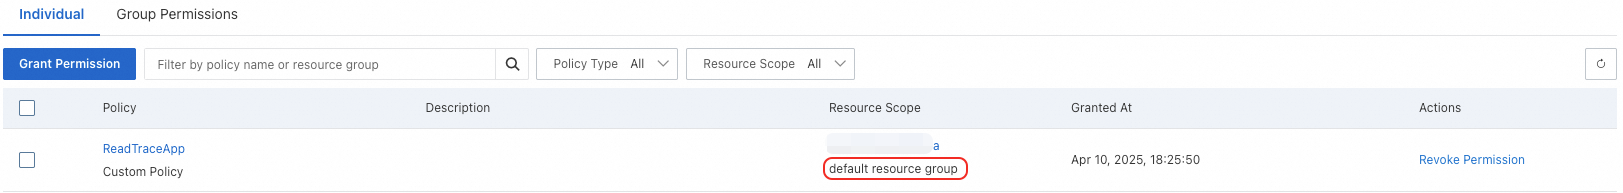
A Resource Access Management (RAM) user with only the `ReadOnlyAccess` or `AliyunARMSReadOnlyAccess` system policy can log on to the ARMS console but cannot view applications. To view applications, you must also grant the `ReadTraceApp` permission for a specific resource group. Otherwise, ARMS cannot display the application list because access is controlled by resource group authentication. For more information, see Customize RAM authorization policies for Application Monitoring.
When you grant the ReadTraceApp access policy, set the resource scope to the resource group level.
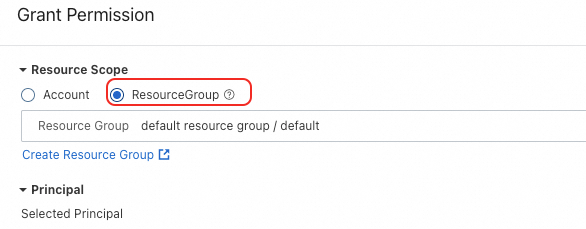
Example: