If you enable data-plane metrics of a Service Mesh (ASM) instance, the data plane generates metric data related to the running status of the gateways and sidecar proxies. After these metrics are collected to Managed Service for Prometheus, you can comprehensively monitor the ASM instance from multiple dimensions, such as the gateway status, at the global level, at the service level, and at the workload level. This way, you can identify potential problems, and adjust and optimize configurations in a timely manner.
Prerequisites
Managed Service for Prometheus is activated for your Alibaba Cloud account. For more information, see Activate ARMS.
The ack-arms-prometheus component is installed in a data-plane cluster. For more information, see Managed Service for Prometheus.
The cluster is added to an ASM instance. For more information, see Add a cluster to an ASM instance.
Procedure
For ASM instances whose versions are earlier than 1.17.2.35
Log on to the ASM console. In the left-side navigation pane, choose .
On the Mesh Management page, click the name of the ASM instance. In the left-side navigation pane, choose .
On the Monitoring indicators page, select Use Managed Service for Prometheus to Collect Metrics and click Collect Metrics to Managed Service for Prometheus. In the Submit message, click OK.
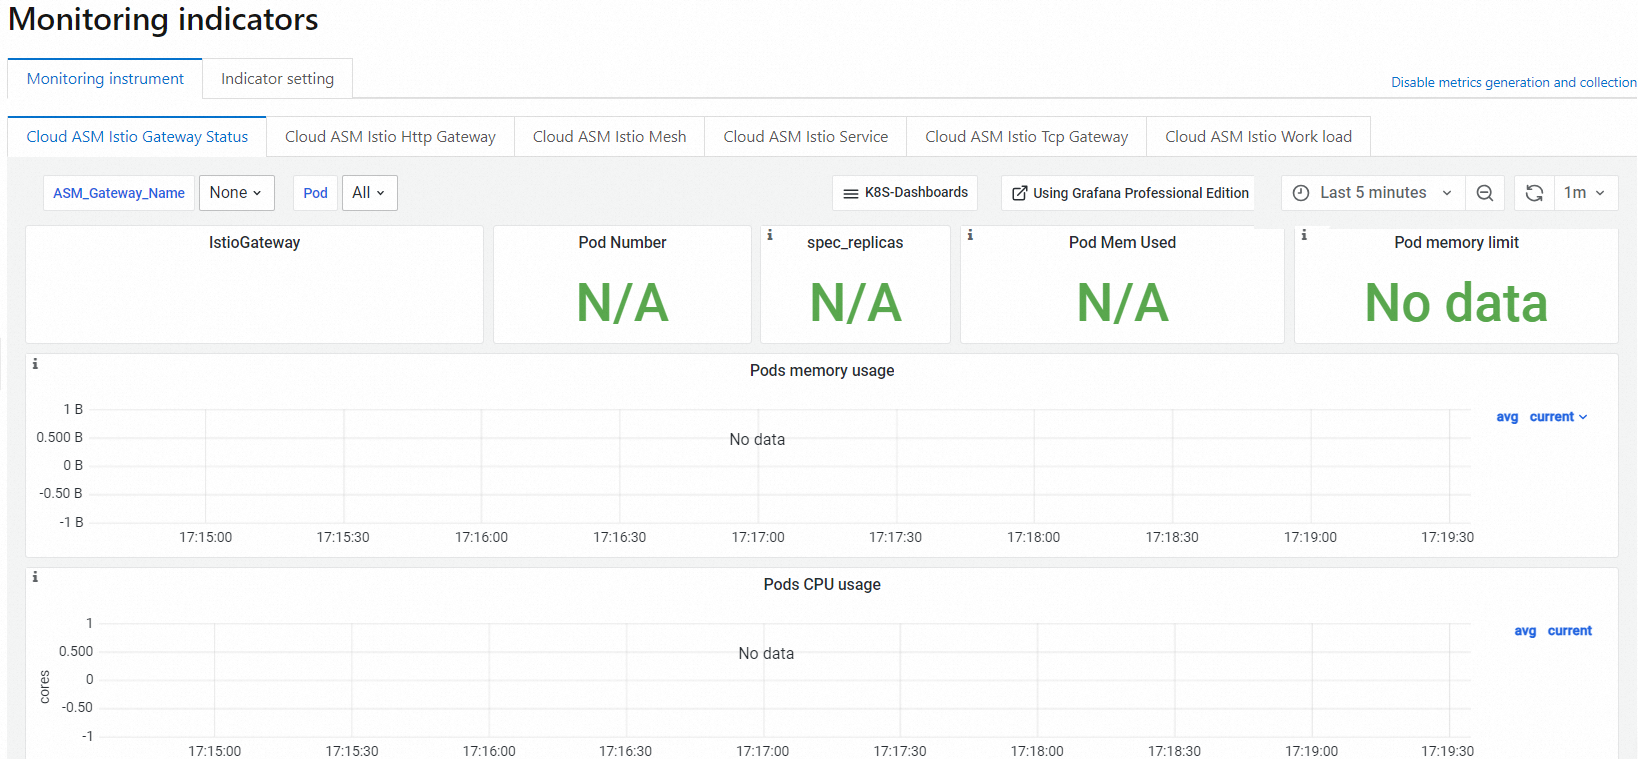
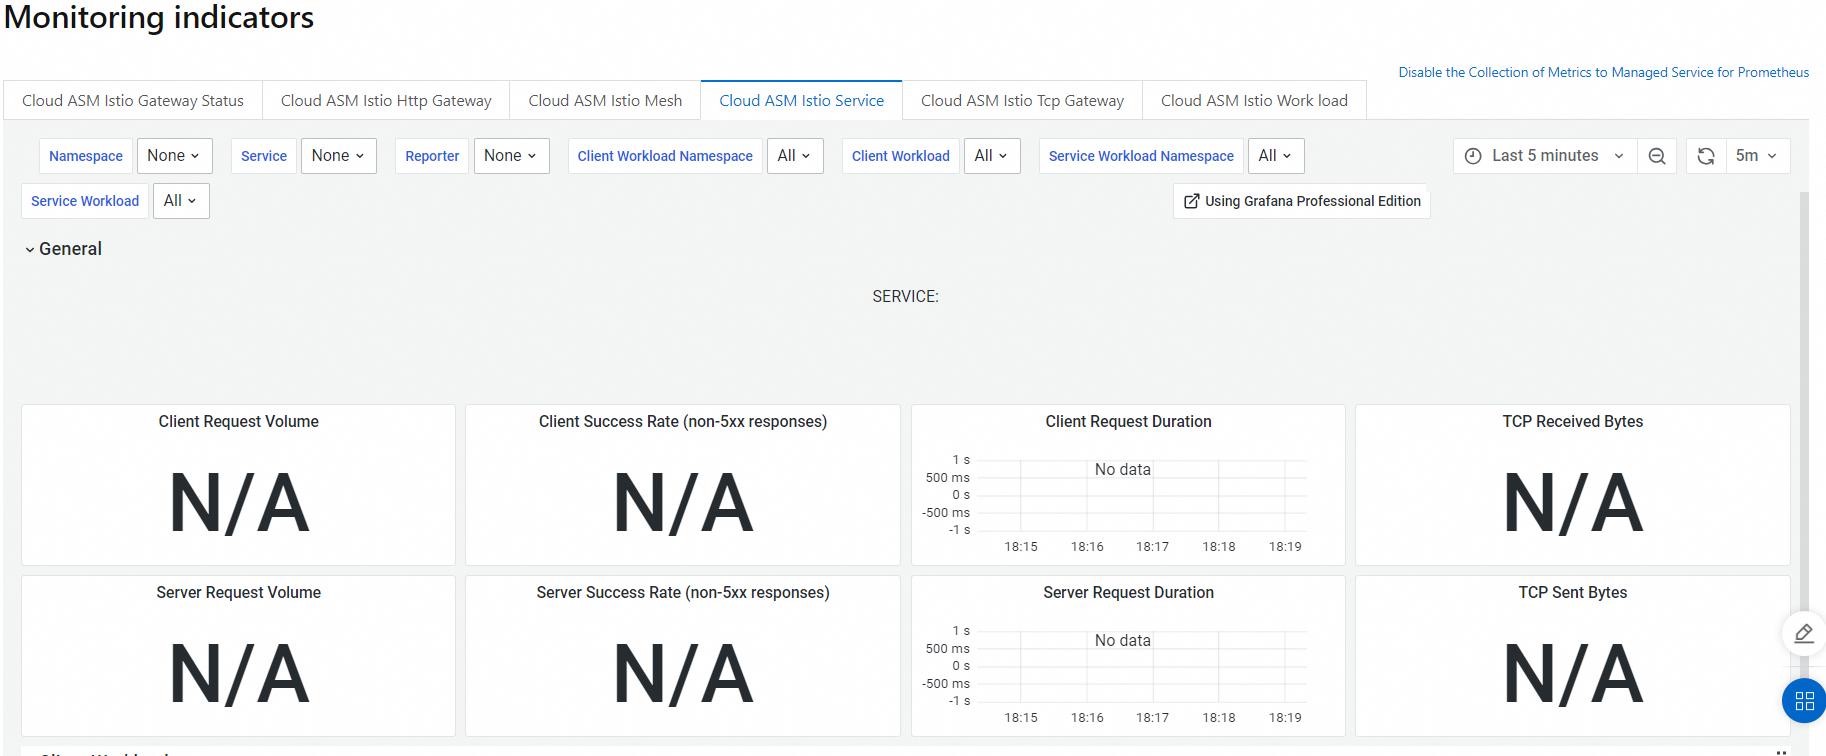
Then, the Monitoring indicators page displays dashboards. You can view multiple dashboards such as Cloud ASM Istio Gateway Status, Cloud ASM Istio Http Gateway, and Cloud ASM Istio Mesh.
 Note
NoteIf you no longer need to use this feature, click Disable the Collection of Metrics to ARMS Prometheus in the upper-right corner of the Monitoring indicators page. In the Submit message that appears, click OK.
If a workload is not restarted after you disable metric collection, the metrics are still exposed by the corresponding gateway or sidecar proxy over ports. However, the values of the metrics do not change. To completely clear the metrics, restart the workload. For more information, see the "(Optional) Redeploy workloads" section in Configure sidecar proxies.
For ASM instances whose versions are 1.17.2.35 or later
Log on to the ASM console. In the left-side navigation pane, choose .
On the Mesh Management page, click the name of the ASM instance. In the left-side navigation pane, choose .
On the Monitoring indicators page, click Collect Metrics to Managed Service for Prometheus. In the Submit message, click OK.
Then, the Monitoring indicators page displays dashboards. You can view multiple dashboards such as Cloud ASM Istio Gateway Status, Cloud ASM Istio Http Gateway, and Cloud ASM Istio Mesh.
If you no longer need this feature, click Disable the Collection of Metrics to Managed Service for Prometheus in the upper-right corner of the Monitoring indicators page. In the Submit message, click OK.
If a workload is not restarted after you disable metric collection, the metrics are still exposed by the corresponding gateway or sidecar proxy over ports. However, the values of the metrics do not change. To completely clear the metrics, restart the workload. For more information, see the "(Optional) Redeploy workloads" section in Configure sidecar proxies.
References
After you collect metrics to Managed Service for Prometheus, you can view the monitoring dashboards in the ASM console or Grafana console. For more information, see Integrate Managed Service for Prometheus to monitor ASM instances.
For more information about how to use a self-managed Prometheus instance to monitor ASM instances, see Monitor ASM instances by using a self-managed Prometheus instance.
For more information about how to customize metrics or log formats, see Create custom metrics in ASM and Customize the format of access logs.
ASM reduces the attack surface in the cloud-native environment and provides a basic framework for building a zero-trust application network. ASM adopts end-to-end encryption, service-level identity authentication, and fine-grained authorization policies to secure service-to-service communication. For more information, see Overview of zero trust security.
You can enable the mesh audit feature to record or trace the daily operations of different users. You can also configure audit alerts for operations on ASM resources and send alert notifications to alert contacts in a timely manner when important resources change. For more information, see Use the KubeAPI operation audit feature in ASM and Configure audit alerts for operations on ASM resources.