After you report the data of an application to Managed Service for OpenTelemetry, Managed Service for OpenTelemetry can monitor the application. On the Dependencies tab, you can view the details of the dependent services of the application, including external calls, database calls, and message queues.
Prerequisites
The data of the application that you want to monitor is reported to Managed Service for OpenTelemetry. For more information, see Connection Description.
View dependent services of an application
Log on to the ARMS console. In the left-side navigation pane, choose .
On the Application List page, select a region in the top navigation bar and click the name of the application that you want to manage.
NoteIf the
 icon is displayed in the Language column, the application is connected to Application Monitoring. If a hyphen (-) is displayed, the application is connected to Managed Service for OpenTelemetry.
 In the top navigation bar, click Dependencies.
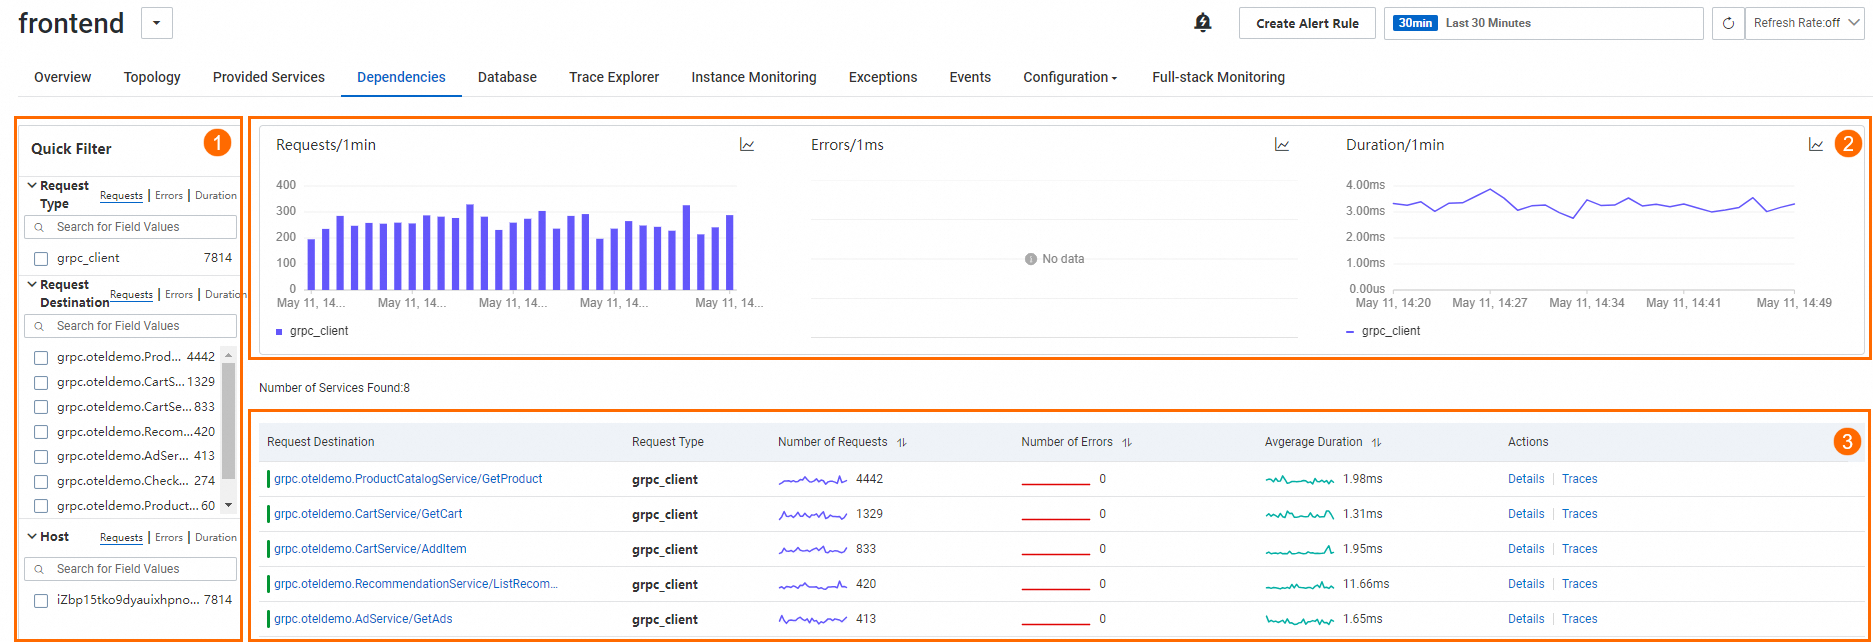
In the preceding figure, ① indicates the Quick Filter section. In this section, you can filter charts and services by request type, operation, and host.
② indicates the trend chart section. In this section, you can view the time series curves of the number of requests, number of errors, and average response time.
Click the
 icon. In the dialog box that appears, you can view the metric data in a specific period of time or compare the metric data in the same period of time on different dates. You can click the
  icon to display the data in a column chart or a trend chart.
 ③ indicates the service list section. In this section, you can view the information about services, including the requested service, request type, number of requests, number of errors, and average response time.
In the service list, you can perform the following operations:
Find a requested service and click the name of the service to view the details of the service. For more information, see the Dependent service details section of this topic.
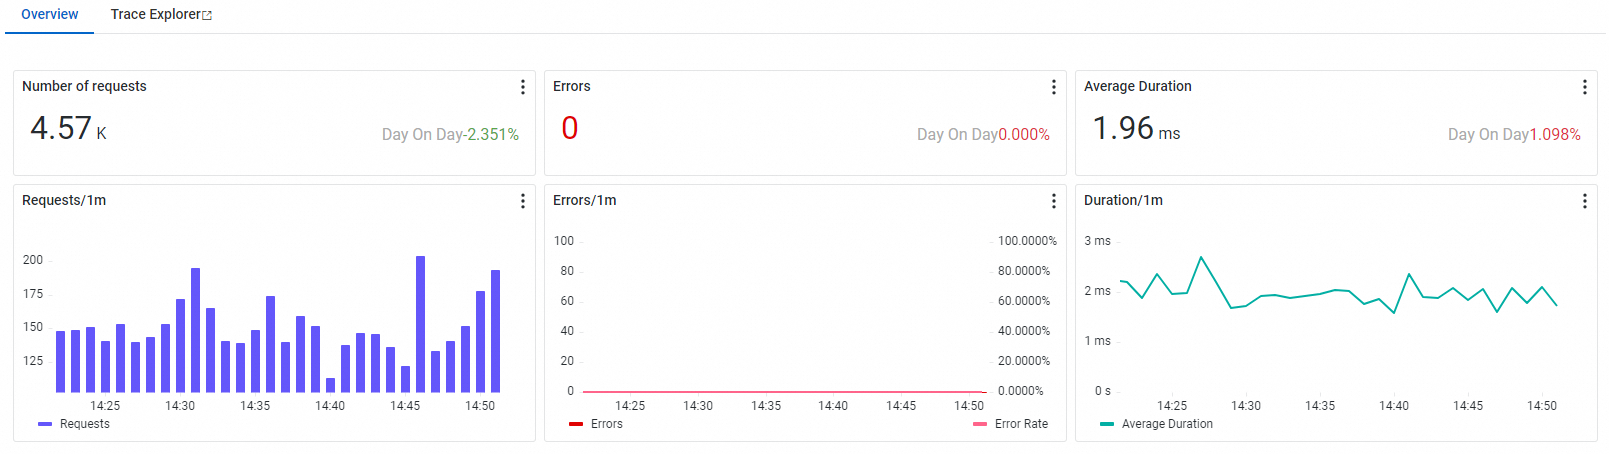
Find a requested service and click Details in the Actions column. In the panel that appears, you can view the overview information about the service, such as the number of requests, number of errors, and average response time.
Find a requested service and click Traces in the Actions column to view the trace details of the dependent service. For more information, see Trace Explorer.
Request types
Types of requests sent from clients:
http_client: HTTP request.
dubbo_client: Dubbo Remote Procedure Call (RPC) request.
dsf_client: High-Speed Service Framework (HSF) RPC request.
hsf_client: Distributed Service Framework (DSF) RPC request.
grpc_client: gRPC request.
thrift_client: Thrift RPC request.
sofa_client: SOFARPC request.
client: common request.
Types of requests sent from message middleware:
kafka_client: request from a producer of a Kafka message queue.
producer: request from a common message producer.
Database types
MySQL
Oracle
PostgreSQL
PPAS
SQL Server
MariaDB
Distributed Memory Databa (DMDB)
Redis
Memcached
MongoDB
DB
Dependent service details
External call and message call
Overview
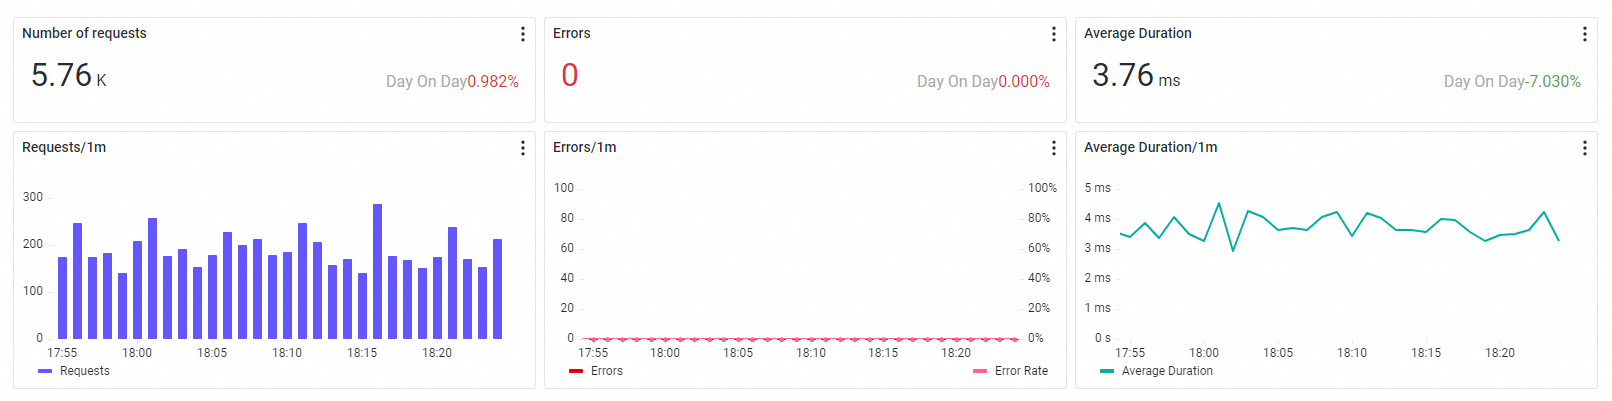
On the Overview tab, you can view the number of requests, number of errors, average response time, and time series curves.
Trace analysis
The Trace Explorer feature allows you to analyze the trace details by combining filter conditions and aggregation dimensions in real time. This allows you to customize diagnostics requirements in different scenarios. For more information, see Trace Explorer.

Database calls
Overview
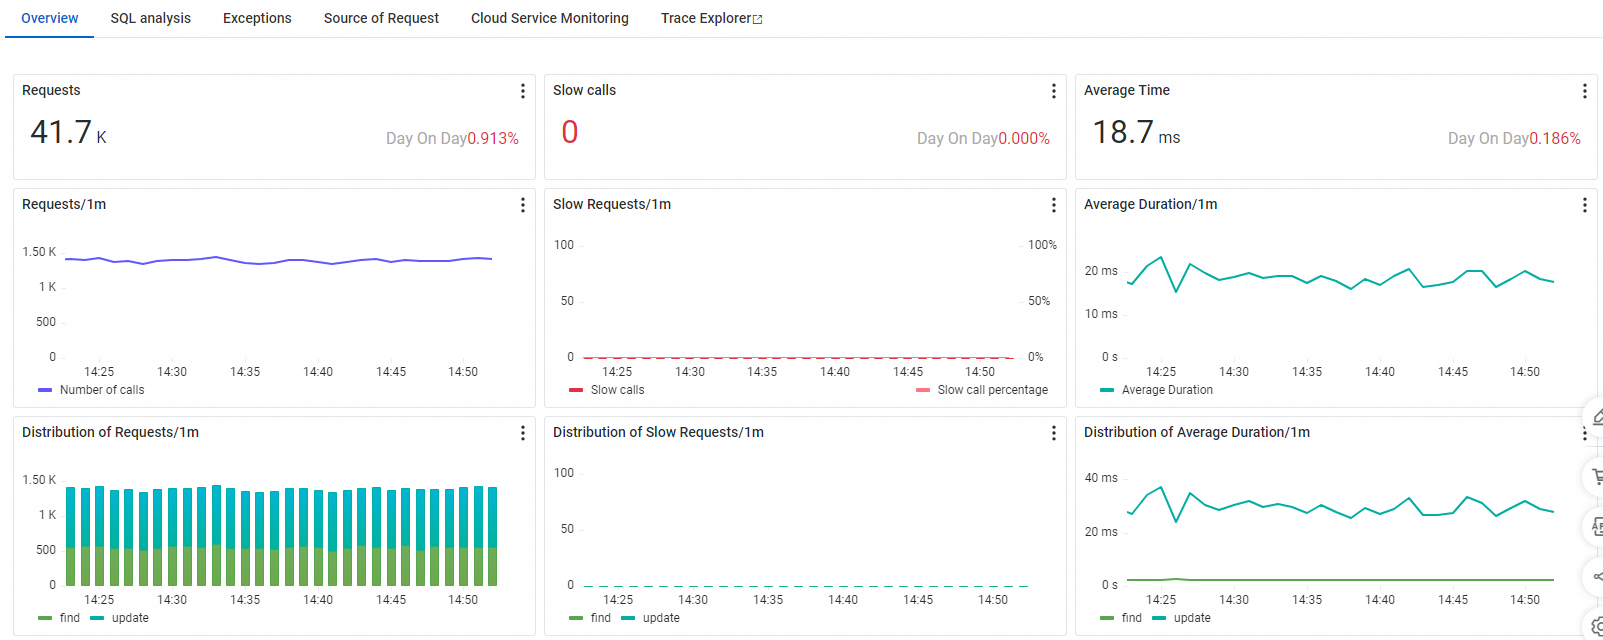
On the Overview tab, you can view the statistical metrics, time series metrics, and distribution of the number of requests to call the selected database instance, number of slow requests, and average response time of the application requests.
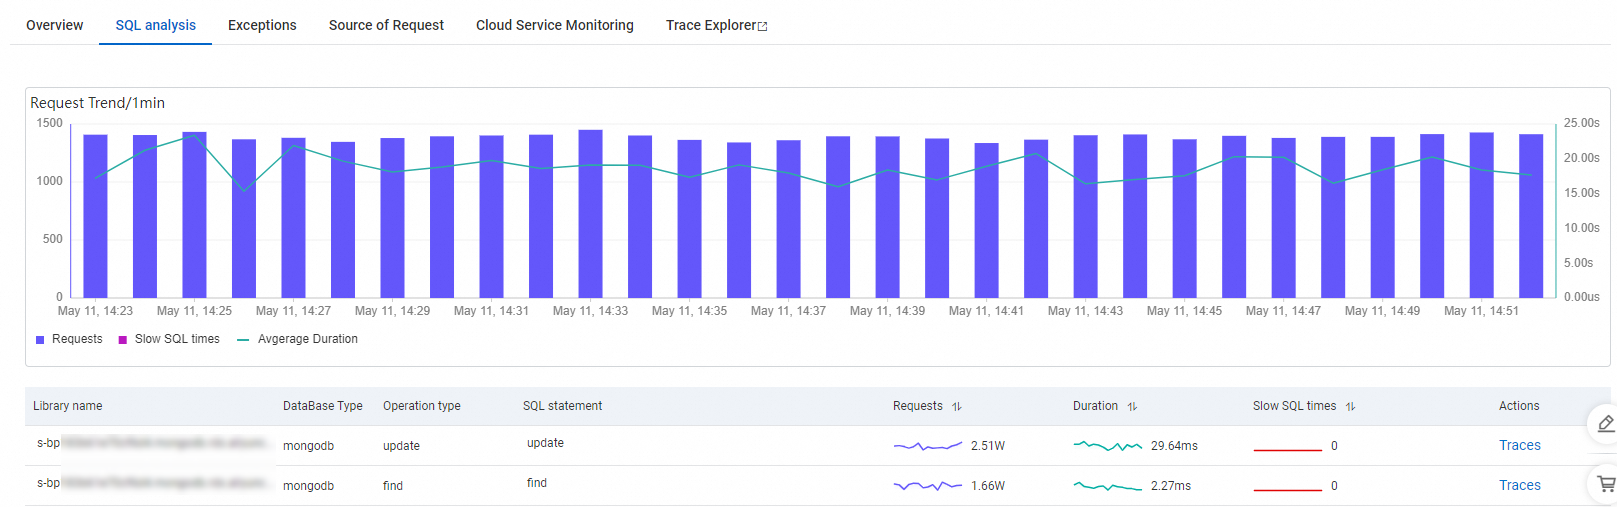
SQL analysis
On the SQL analysis tab, you can view the trend of the requests to call the selected database instance, including the number of requests, number of slow SQL queries, and average response time, and the SQL query statistics of the selected database instance.
You can click Traces in the Actions column to view the trace of an SQL statement. For more information, see Trace Explorer.
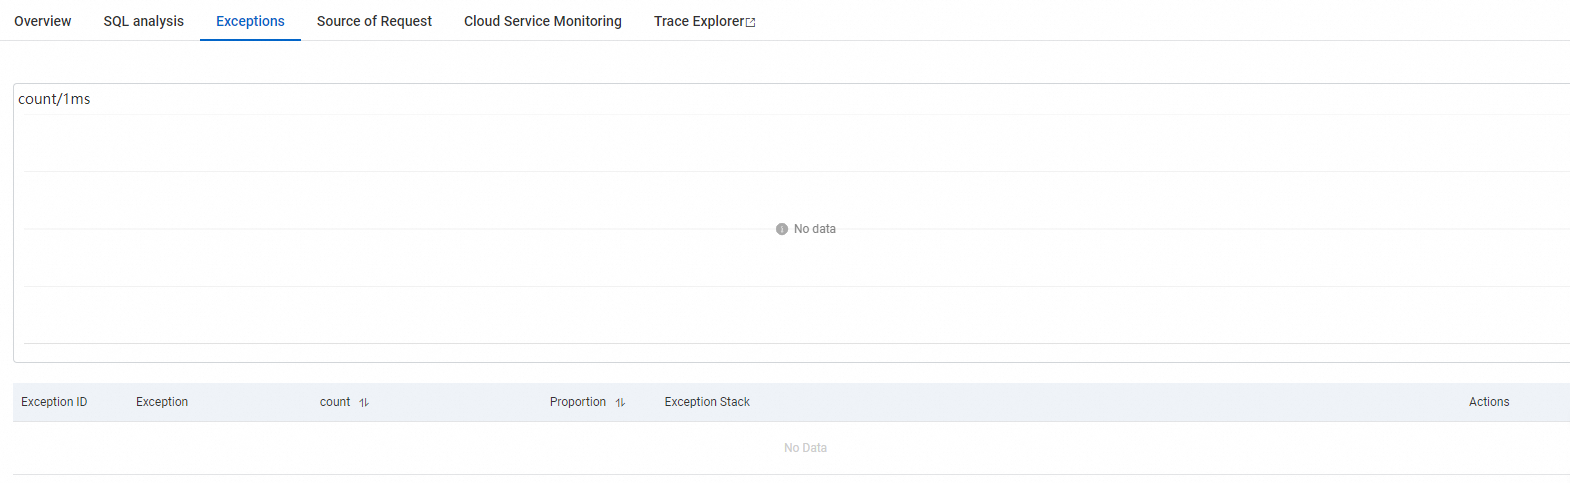
Exception analysis
On the Exceptions tab, you can view the number of times the exception is reported when the application calls the database instance within the specified time range, as well as the details of the exception. For more information, see Exception analysis.
Request source
On the Source of Request tab, you can view the time series curves of the response time, number of requests, and number of errors when the application calls the source operations of the database instance.
Trace analysis
The Trace Explorer feature allows you to analyze the trace details by combining filter conditions and aggregation dimensions in real time. This allows you to customize diagnostics requirements in different scenarios. For more information, see Trace Explorer.
References
To prevent errors from being diagnosed after the errors occur, you can use the alerting feature to create alert rules for one or all operations. This way, the system sends notifications to the O&M team when the errors occur. For more information about how to create an alert rule, see Application monitoring alert rules.