After you report the data of an application to Managed Service for OpenTelemetry, Managed Service for OpenTelemetry can monitor the application. On the Database tab, you can view the database analysis data to understand the database call details.
Prerequisites
The data of the application that you want to monitor is reported to Managed Service for OpenTelemetry. For more information, see Connection Description.
View database analysis data
Log on to the ARMS console. In the left-side navigation pane, choose .
On the Application List page, select a region in the top navigation bar and click the name of the application that you want to manage.
NoteIf the
 icon is displayed in the Language column, the application is connected to Application Monitoring. If a hyphen (-) is displayed, the application is connected to Managed Service for OpenTelemetry.
 In the top navigation bar, click Database.
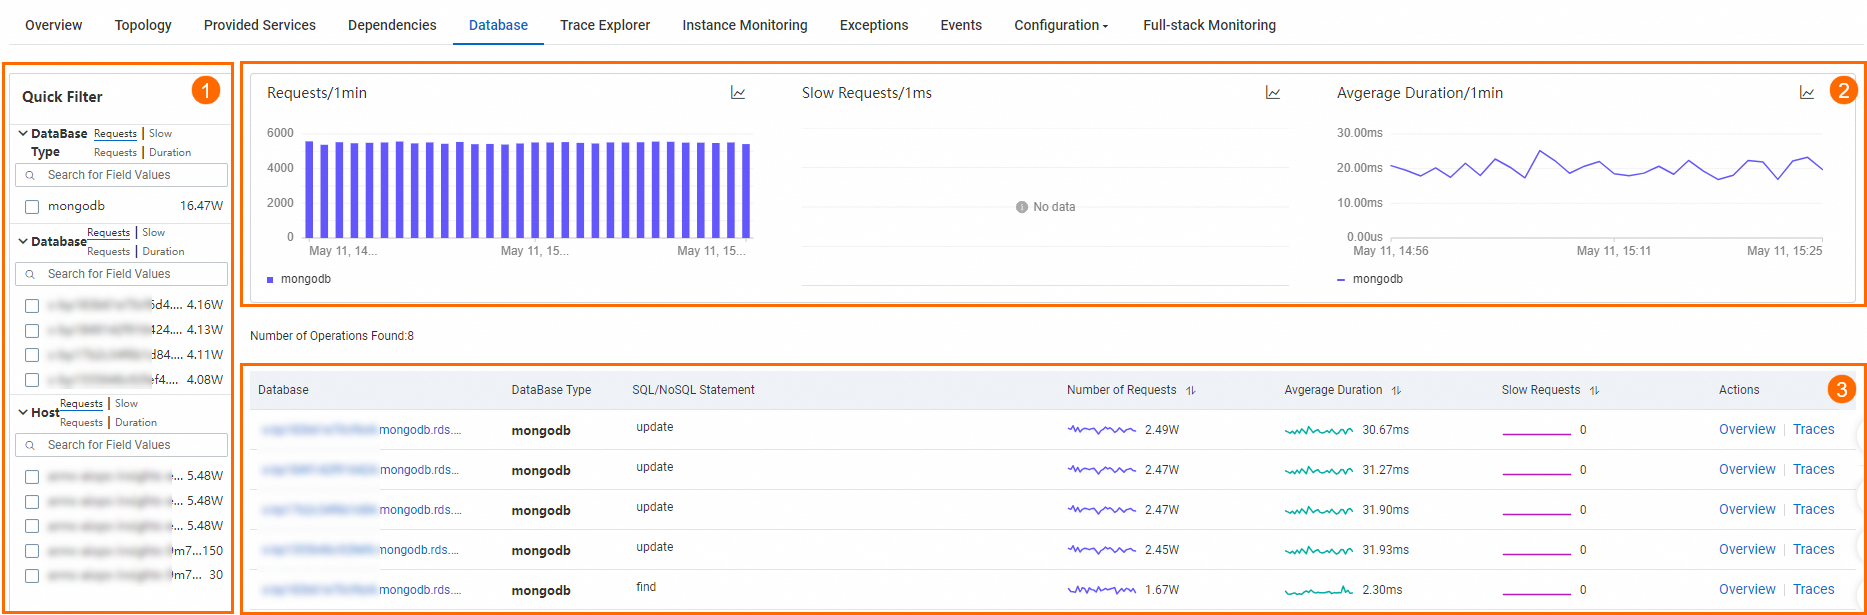
In the preceding figure, ① indicates the Quick Filter section. In this section, you can filter charts and databases by database type, database name, and host.
② indicates the trend chart section. In this section, you can view the time series curves of the number of requests, number of errors, and average response time.
Click the
 icon. In the dialog box that appears, you can view the metric data in a specific period of time or compare the metric data in the same period of time on different dates. You can click the
  icon to display the data in a column chart or a trend chart.
 ③ indicates the database list section. In this section, you can view the information about databases, including the database name, database type, statement, number of requests, number of errors, and average response time.
In the database list section, you can perform the following operations:
Find a database and click the name of the database to view the service details. For more information, see the Database details section of this topic.
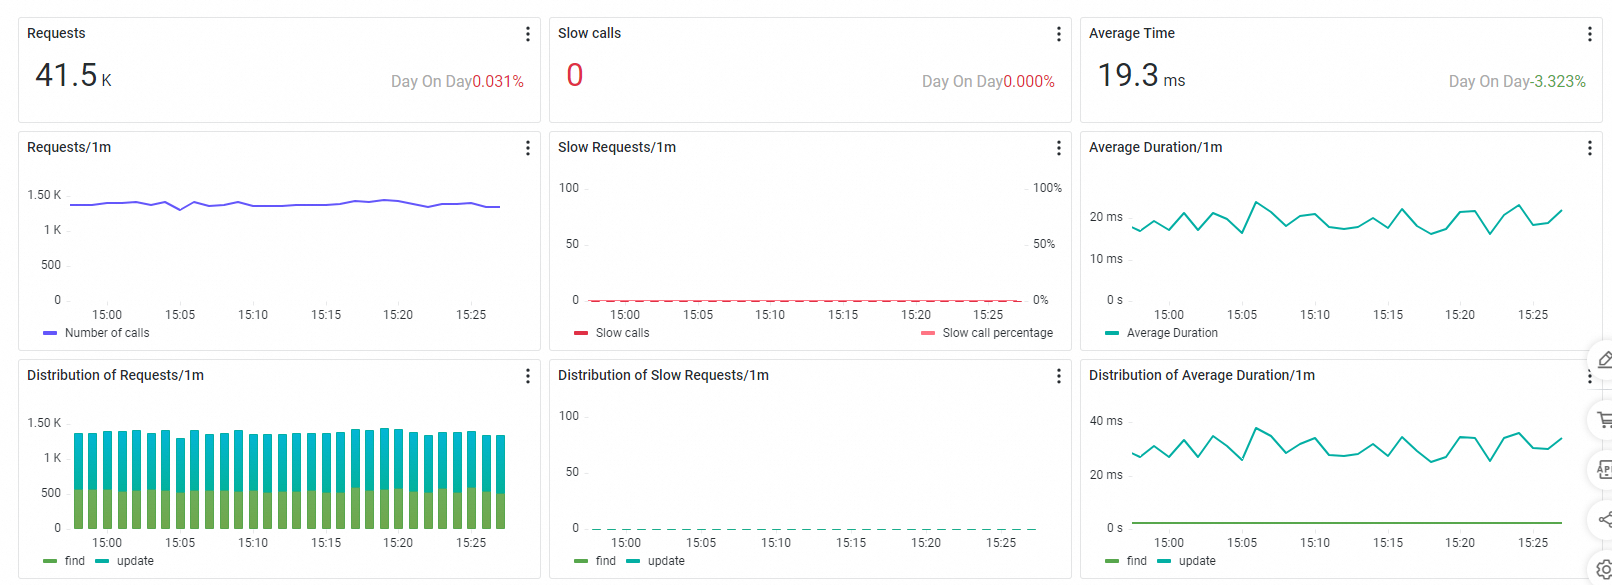
Find a database and click Overview in the Actions column. In the panel that appears, you can view the overview information about the database, such as the number of requests, number of slow calls, average response time, and call distribution.
Find a database and click Traces in the Actions column to view the details of the database trace. For more information, see Trace analysis.
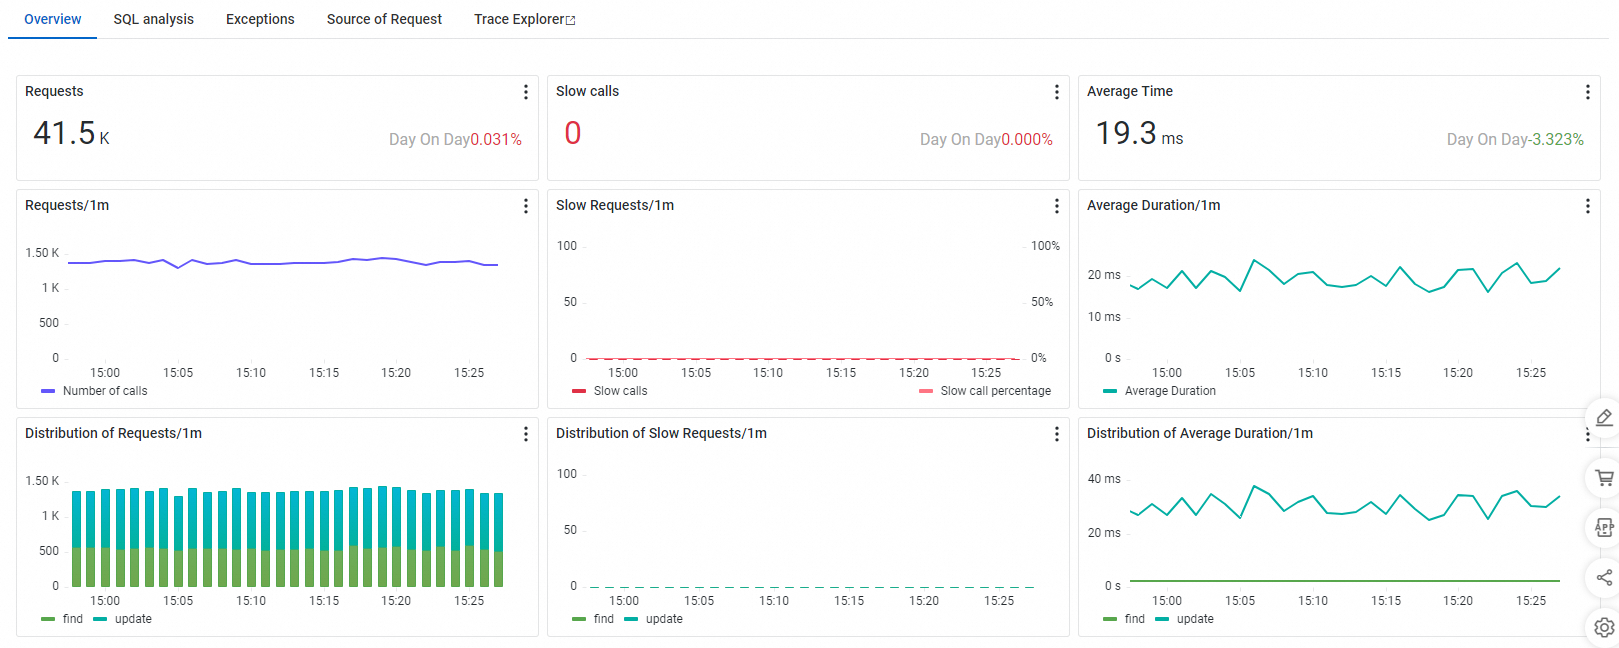
Database details
Overview
On the Overview tab, you can view the time series curves and distribution of the number of requests, number of slow calls, and average response time.
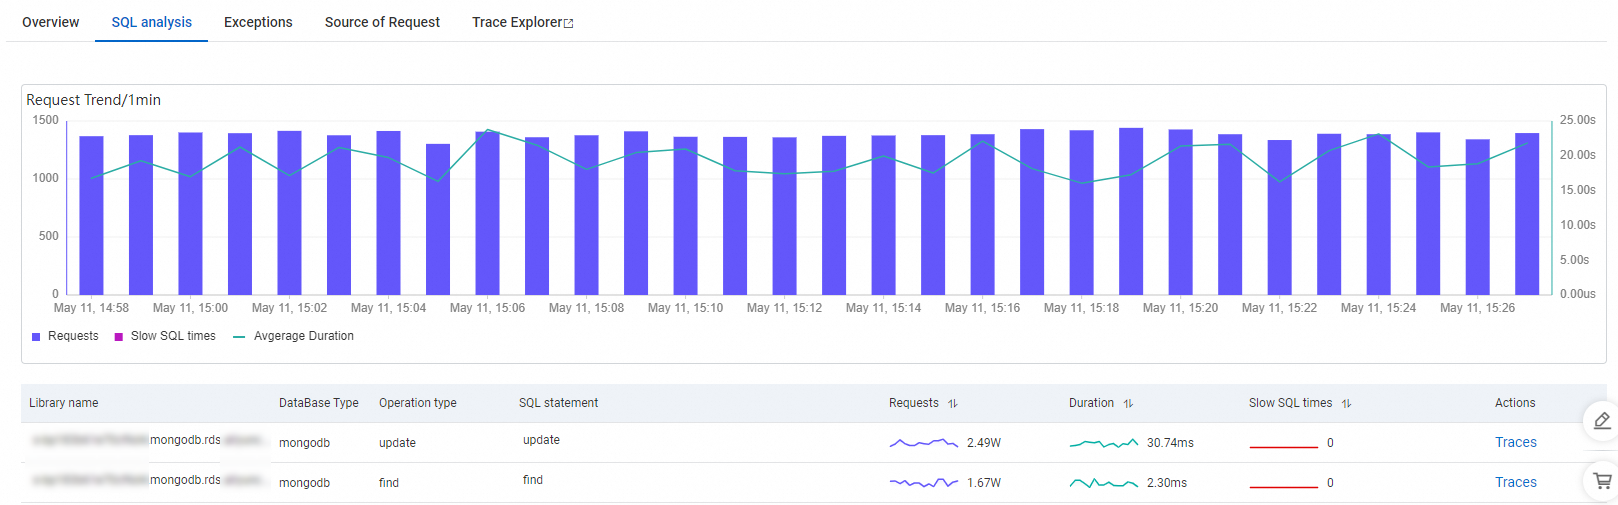
SQL analysis
On the SQL analysis tab, you can view the trend of the requests to call the selected database instance, including the number of requests, number of slow SQL queries, and average response time, and the SQL query statistics of the selected database instance.
You can click Traces in the Actions column to view the trace of an SQL statement. For more information, see Trace Explorer.
Exception analysis
On the Exceptions tab, you can view the number of times the exception is reported when the application calls the database instance within the specified time range, as well as the details of the exception. For more information, see Exception analysis.

Request source
On the Source of Request tab, you can view the time series curves of the response time, number of requests, and number of errors when the application calls the source operations of the database instance.
Trace analysis
The Trace Explorer feature allows you to analyze the trace details by combining filter conditions and aggregation dimensions in real time. This allows you to customize diagnostics requirements in different scenarios. For more information, see Trace Explorer.
References
To prevent errors from being diagnosed after the errors occur, you can use the alerting feature to create alert rules for one or all operations. This way, the system sends notifications to the O&M team when the errors occur. For more information about how to create an alert rule, see Application monitoring alert rules.