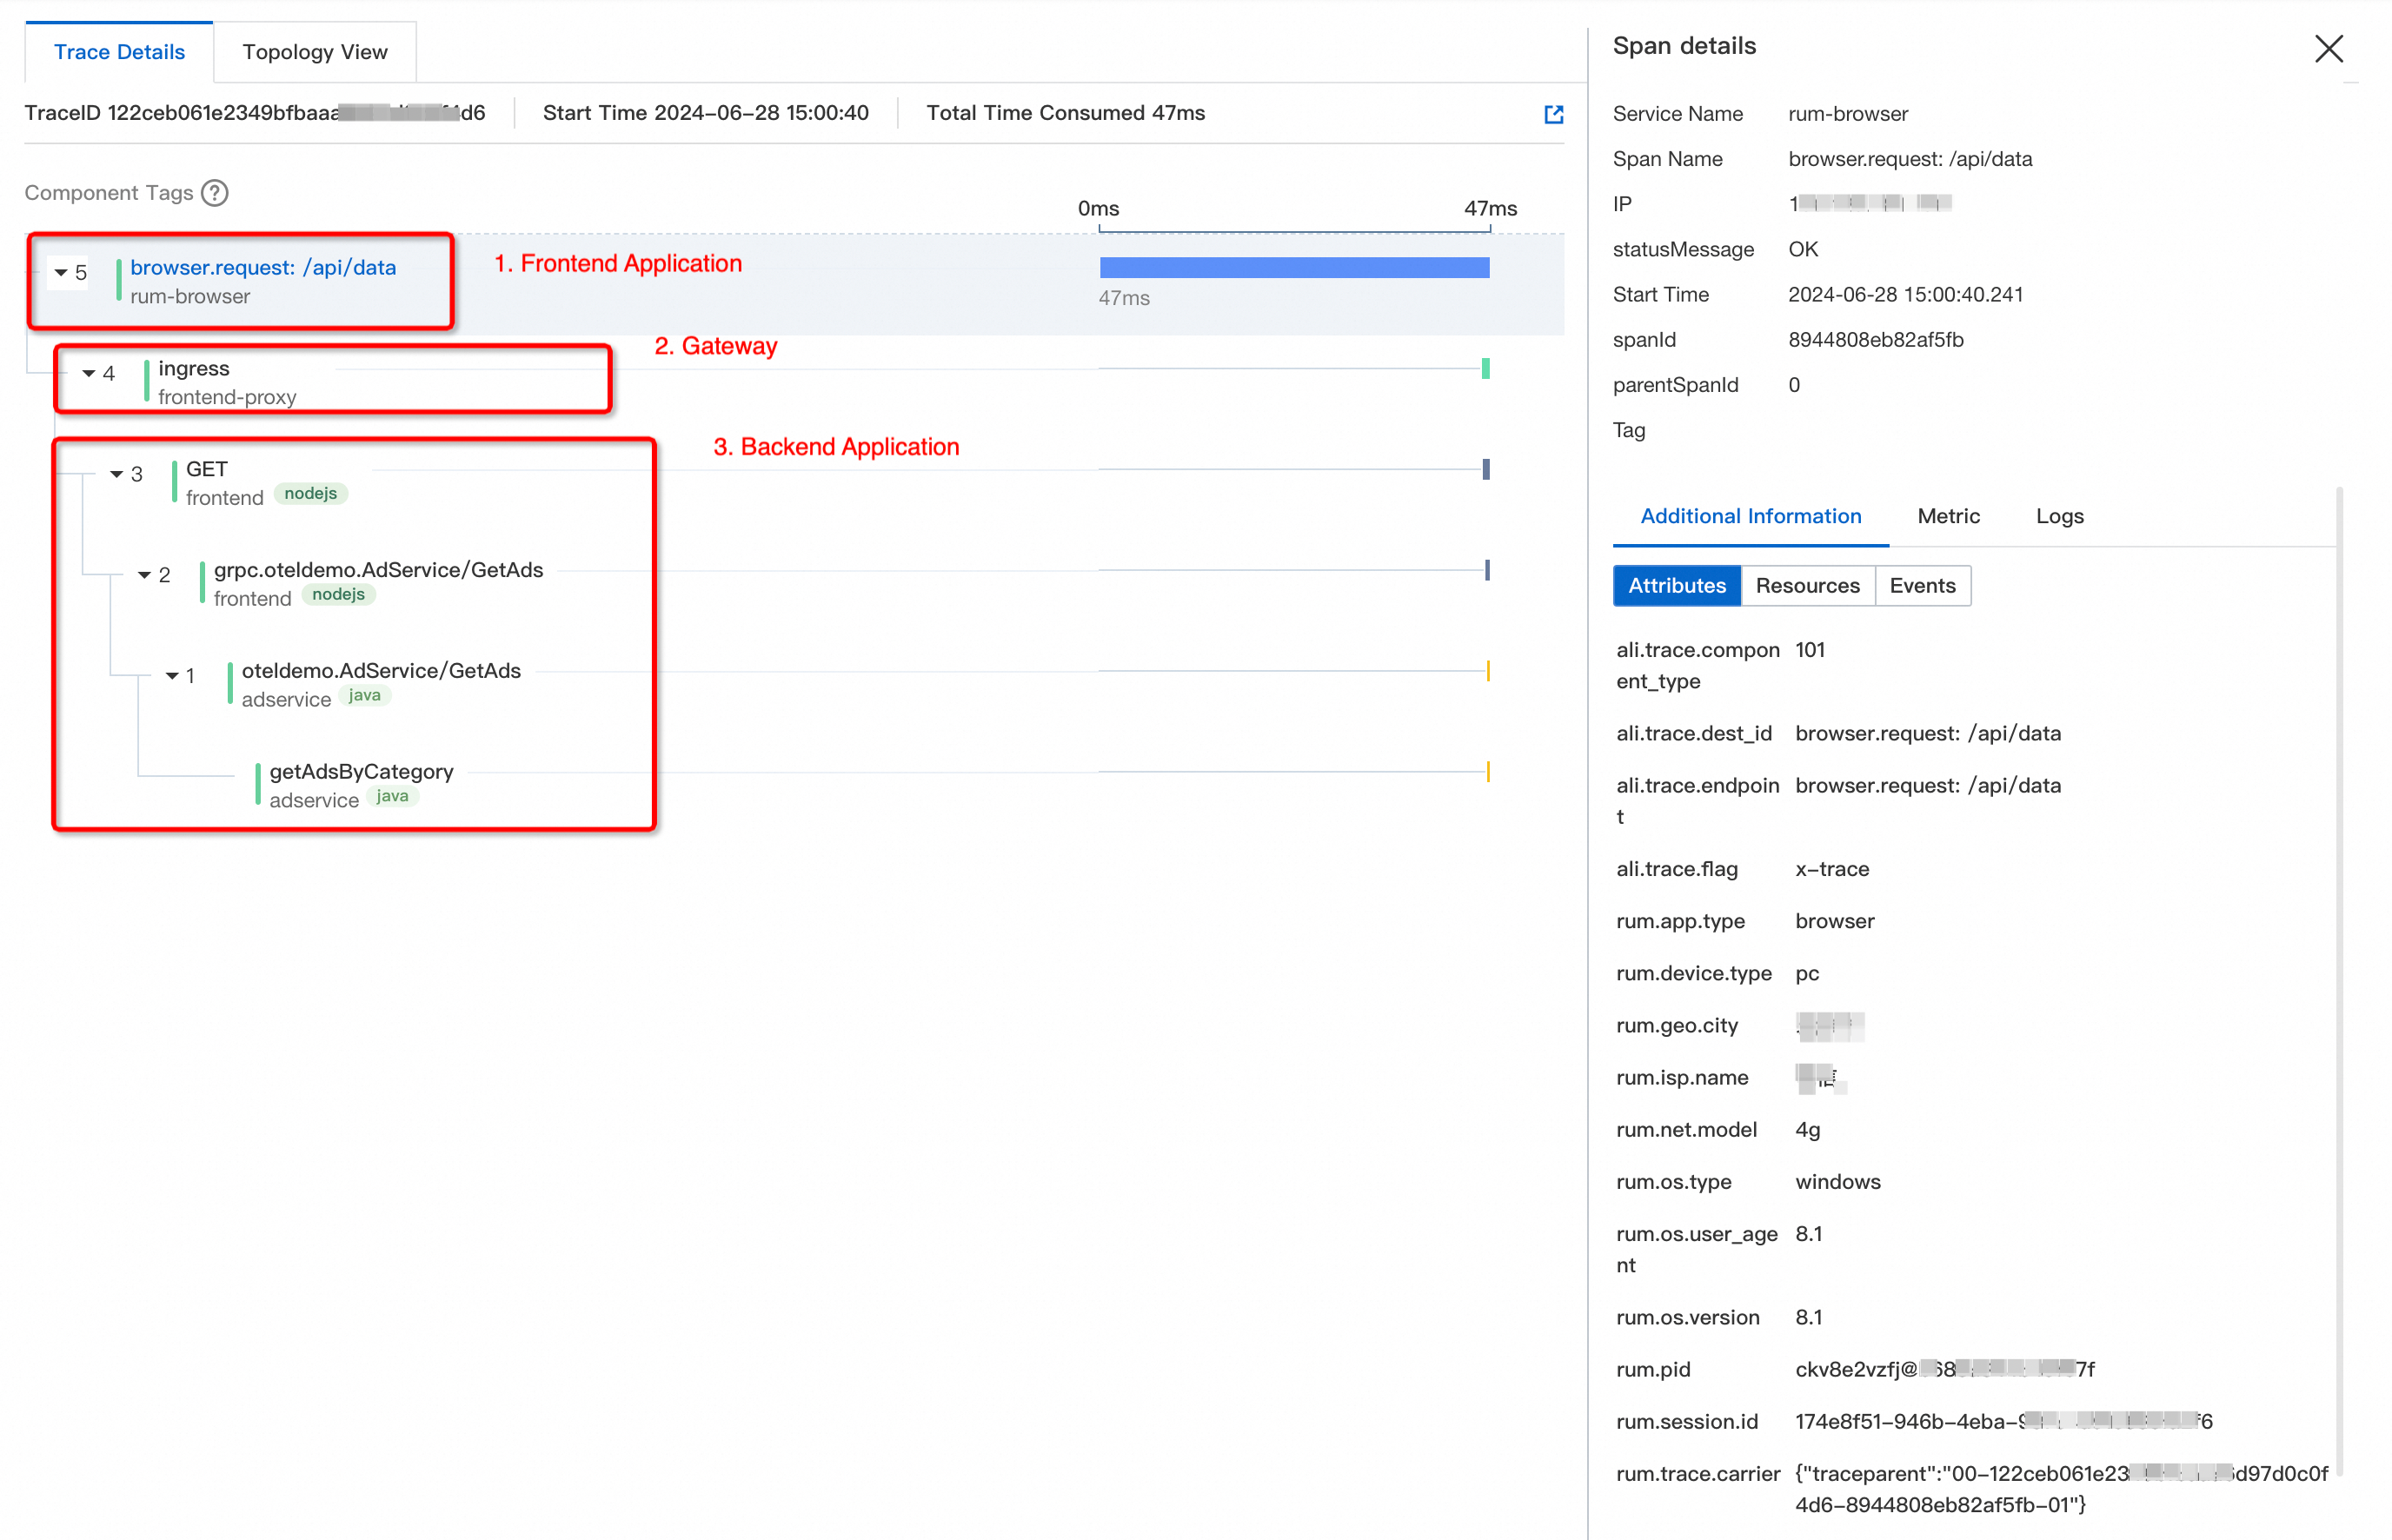
When a request crosses multiple services but your traces only cover some of them, blind spots make it difficult to locate the root cause of slow or failed requests. End-to-end tracing eliminates these blind spots by linking user terminals, cloud gateways, backend applications, and dependent services into a single, continuous trace.
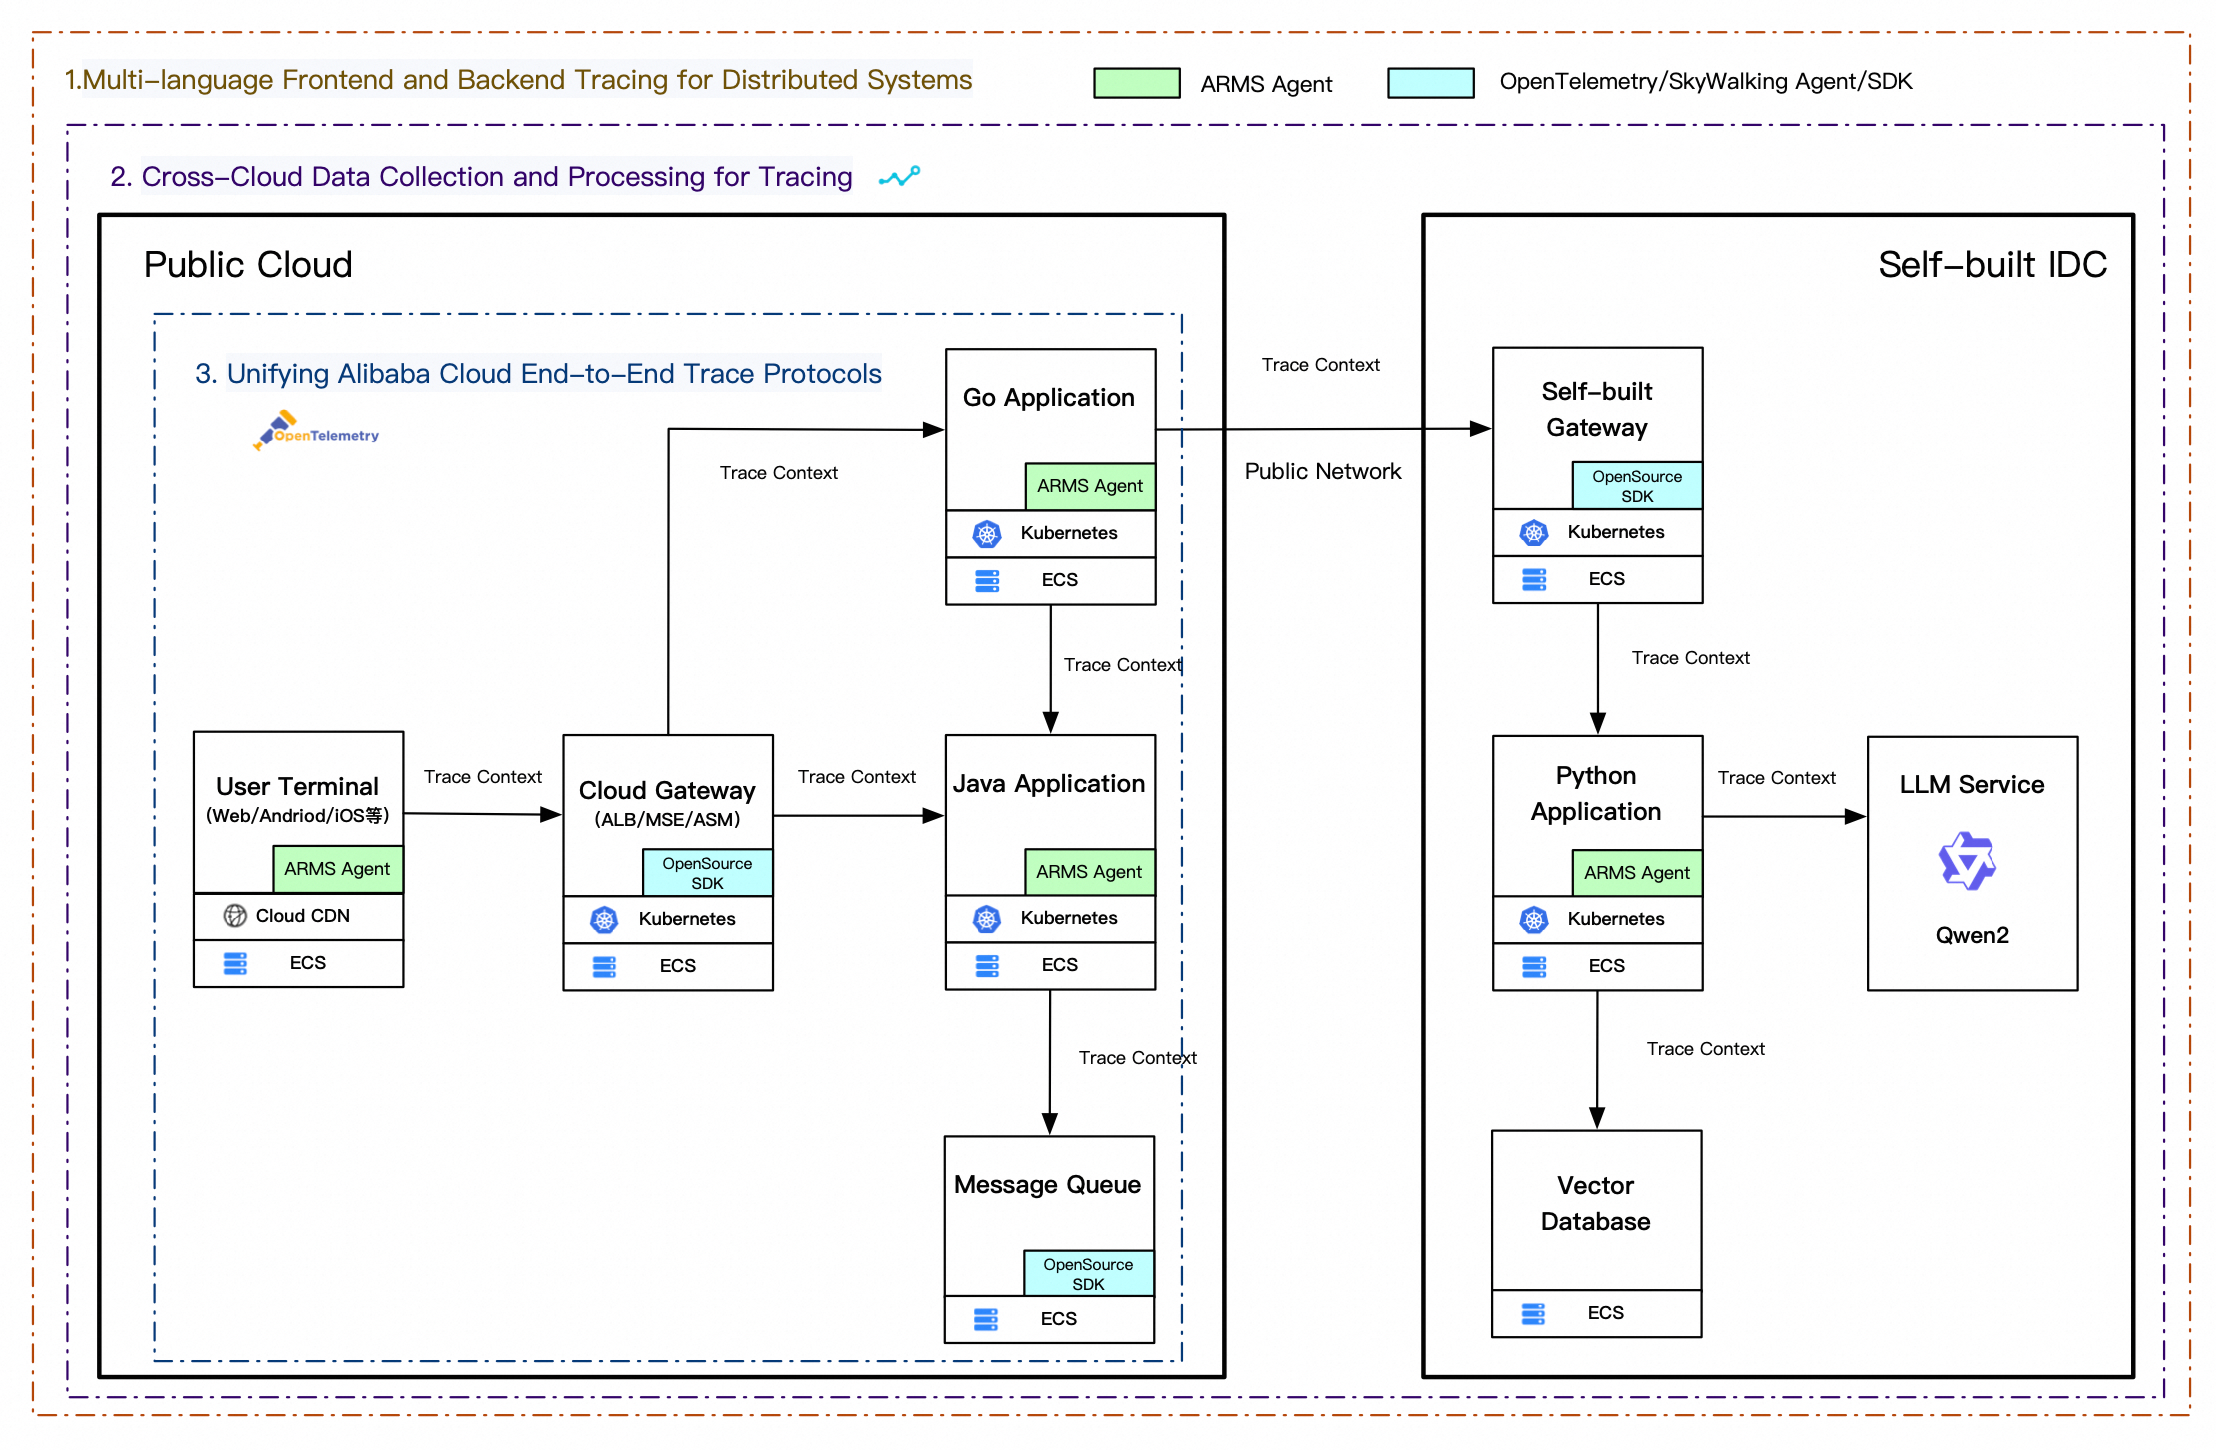
Application Real-Time Monitoring Service (ARMS) and Managed Service for OpenTelemetry together support end-to-end tracing across these layers:
User terminals: Browser, Android, and iOS
Cloud gateways: Application Load Balancer (ALB), Microservice Engine (MSE), NGINX Ingress Controller, and Service Mesh
Backend applications: Java, Go, Python, .NET, and more
Dependent services: Databases, message queues, and large models
Choose the right instrumentation approach
Two instrumentation paths are available. Use both together in multi-language environments because ARMS and Managed Service for OpenTelemetry are fully interoperable.
ARMS Application Monitoring (recommended for Java, Go, and Python): A self-developed agent with a guaranteed SLA. Provides automatic instrumentation, flexible sampling policies, agent management, self-monitoring, and dynamic feature degradation.
Managed Service for OpenTelemetry (all other languages): An open-source client compatible with OpenTelemetry, SkyWalking, Zipkin, and Jaeger. Supports automatic or manual instrumentation for more than 10 languages.
Language | ARMS Application Monitoring | Managed Service for OpenTelemetry | Recommended |
Java | Automatic instrumentation | Automatic instrumentation | ARMS |
Go | Automatic instrumentation | Automatic instrumentation | ARMS |
Python | Automatic instrumentation | Automatic instrumentation | ARMS |
Node.js | Unsupported | Automatic instrumentation | OpenTelemetry |
.NET | Unsupported | Automatic instrumentation | OpenTelemetry |
PHP | Unsupported | Automatic instrumentation | OpenTelemetry |
Erlang | Unsupported | Automatic instrumentation | OpenTelemetry |
C++ | Unsupported | Manual instrumentation | OpenTelemetry |
Swift | Unsupported | Manual instrumentation | OpenTelemetry |
Ruby | Unsupported | Manual instrumentation | OpenTelemetry |
Rust | Unsupported | Manual instrumentation | SkyWalking |
ARMS agent for Java v4.0
Released in 2024, the ARMS agent for Java v4.0 is fully built on the OpenTelemetry framework. In addition to standard tracing, it captures resource monitoring, performance diagnostics, and application security data. The agent supports:
Flexible trace sampling policies
Agent management with self-monitoring
Dynamic feature degradation for production stability
Integrate tracing with Alibaba Cloud services
A common challenge on the cloud is determining whether a performance issue originates in your code, a cloud gateway, or a managed service. End-to-end tracing addresses this by including cloud service spans in the same trace as your application spans.
Managed Service for OpenTelemetry integrates with nearly 10 Alibaba Cloud services. To start collecting trace data, enable the tracing option in each service's console.
Trace collection methods
Cloud services collect trace data in two ways:
| Collection method | How it works | Example | Trade-off |
|---|---|---|---|
| Direct trace reporting (recommended) | The service instruments internally and reports spans through an Exporter. | User Experience Monitoring (RUM) | More detailed and flexible |
| Log-to-trace conversion | Backend systems convert access logs into trace data. | ALB | Less intrusive, but less granular |
Direct reporting follows standard instrumentation. Use log-to-trace conversion when the system has strict performance constraints or when direct instrumentation is impractical, as long as the logs contain trace context (such as TraceId).
Supported cloud services and tracing protocols
Category | Service | Setup guide | Tracing protocol |
User terminal | Web apps, HTML5 apps, and mini programs | Enable end-to-end tracing for a web application or mini program | W3C, B3, Jaeger, SkyWalking |
Android and iOS apps | W3C, SkyWalking | ||
Gateway | MSE | W3C, B3, SkyWalking | |
NGINX Ingress Controller | W3C, B3, Jaeger | ||
ALB | B3 | ||
Service Mesh | B3 | ||
API Gateway | B3 | ||
Backend application | Java, Go, Python (ARMS agent) | W3C, B3, Jaeger, SkyWalking, EagleEye | |
.NET, Node.js, and other languages | W3C, B3, Jaeger, SkyWalking | ||
Dependent service | 100+ supported components. Covers RPC, message queues, databases, and task scheduling. | ||
Propagate trace context across services
Instrumenting individual services is only the first step. Upstream and downstream services must agree on a trace context propagation protocol so that spans connect into a single, continuous trace.
Managed Service for OpenTelemetry provides end-to-end trace connectivity based on the W3C Trace Context protocol and is progressively expanding support for additional protocols and services.
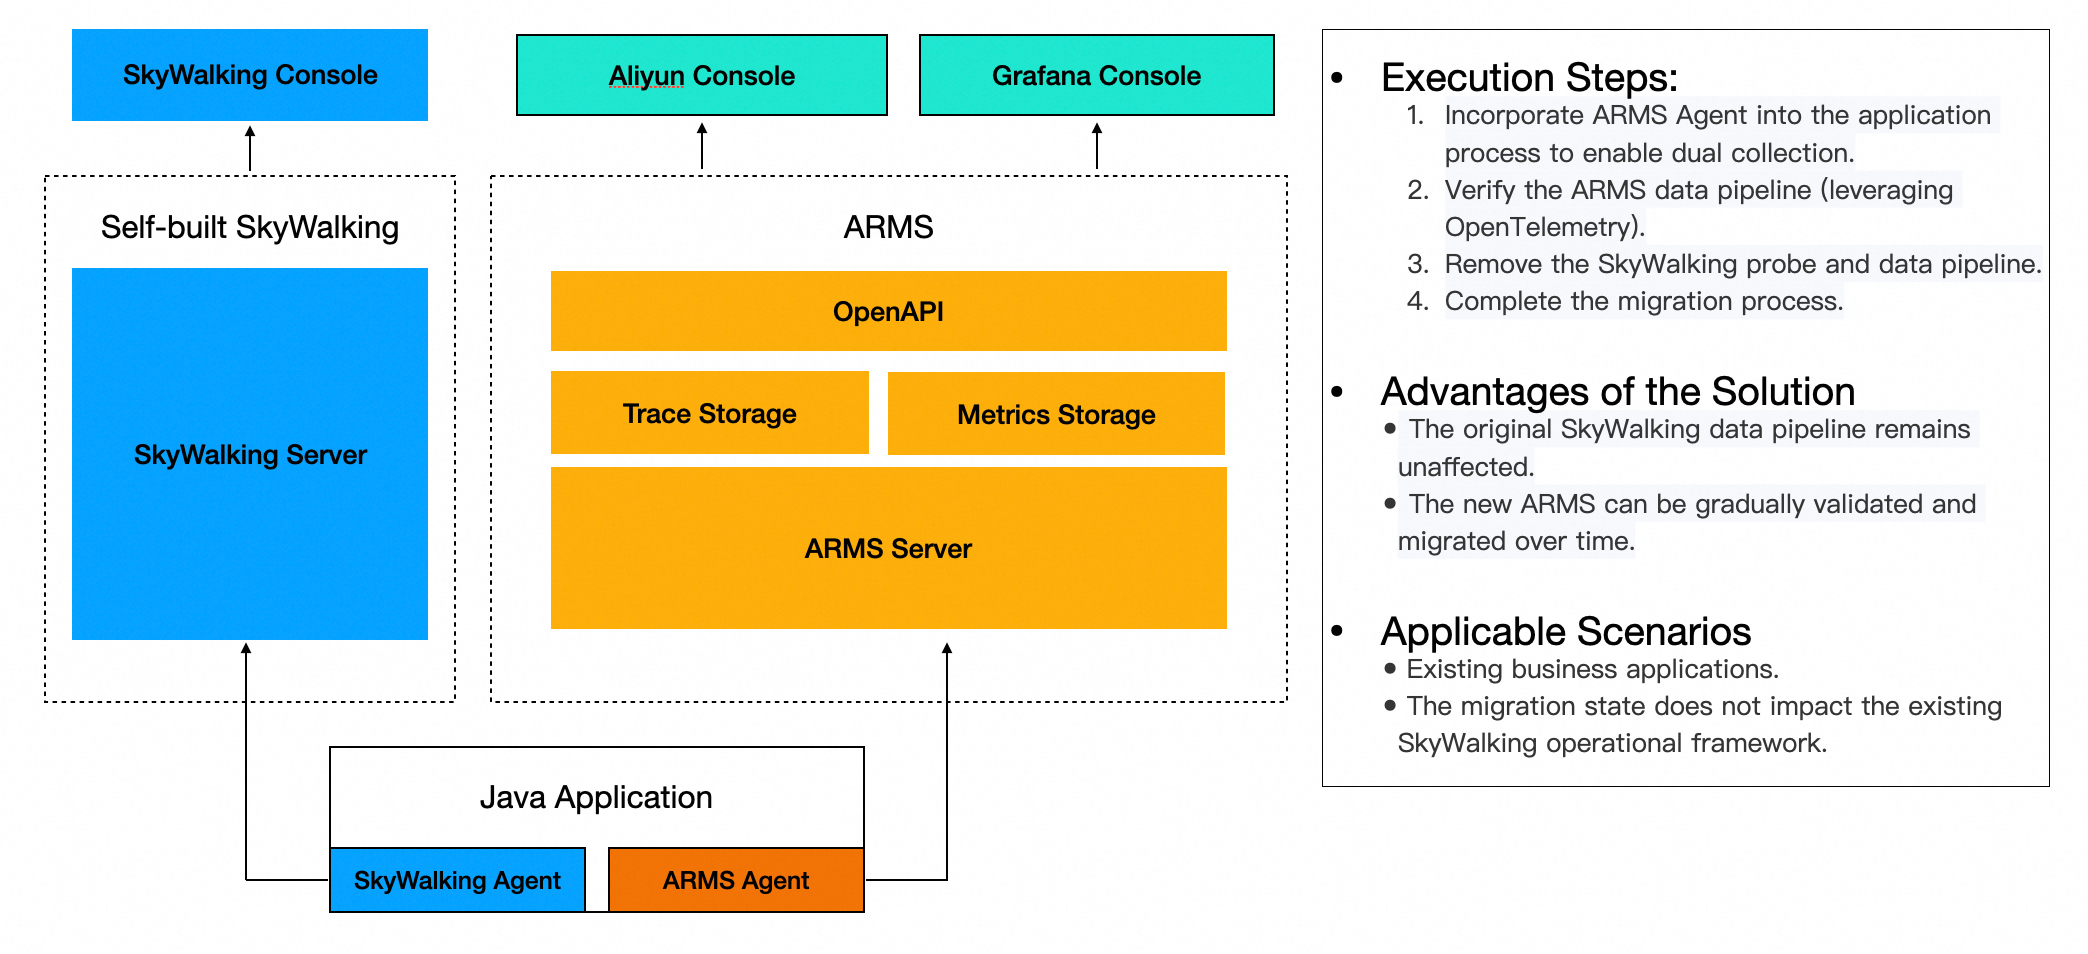
Migrate between tracing systems with dual-agent coexistence
Unifying protocols across services that already run different tracing systems is a common challenge, especially during technology transitions such as migrating from SkyWalking to OpenTelemetry.
The ARMS agent supports dual-agent coexistence: both the existing and new tracing systems run side by side. This lets you validate the new setup without disrupting production monitoring. Remove the old agent after migration completes.
Use the ARMS agent as a protocol mediator
When upstream and downstream services use different propagation protocols and neither can easily switch, the ARMS agent acts as a protocol mediator. It recognizes incoming trace context in one format and forwards it in another.
Example: Application A sends traces using the Jaeger protocol. The ARMS agent receives the Jaeger context and forwards it in both Jaeger and Zipkin B3 format to downstream Application B, which expects B3. Trace continuity is preserved across the protocol boundary without code changes in either application.
Plan your rollout
For large distributed systems, enable end-to-end tracing incrementally rather than all at once:
Start with business-critical paths. Identify the requests most important to your business or most likely to require troubleshooting. Instrument those services first.
Expand to adjacent services. After core services report traces, check the trace topology for external calls to uninstrumented services. Enable tracing for those next.
Unify protocols. If services use different tracing protocols, deploy the ARMS agent as a protocol mediator or plan a phased migration with dual-agent coexistence.
Enable cloud service tracing. Turn on tracing for cloud gateways and dependent services to close the remaining gaps in your trace topology.
Tune sampling. After achieving full coverage, adjust sampling policies (available in ARMS agent for Java v4.0) to balance observability depth with resource cost.