Container Service for Kubernetes (ACK) provides a tracing feature that allows you to send traces from the NGINX Ingress Controller component in your ACK cluster to Managed Service for OpenTelemetry. Managed Service for OpenTelemetry
Prerequisites
-
You have activated Managed Service for OpenTelemetry and granted the required permissions.
-
The NGINX Ingress controller is installed. For more information, see Manage the NGINX Ingress controller.
Version compatibility
Support for tracing varies across different versions of the NGINX Ingress controller component, so you need to select the configuration method that is appropriate for your version.
|
NGINX Ingress controller version |
OpenTelemetry |
OpenTracing |
|
≥ v1.10.2-aliyun.1 |
Supported |
Not supported |
|
v1.9.3-aliyun.1 |
Supported |
Supported |
|
v1.8.2-aliyun.1 |
Supported |
Supported |
|
< v1.8.2-aliyun.1 |
Not supported |
Supported |
Procedure
OpenTelemetry
Step 1: Obtain endpoint information
-
Log on to the ARMS console. In the left-side navigation pane, click Integration Center.
-
In the Server-side Applications area, click the OpenTelemetry card.
-
In the OpenTelemetry panel that appears, select the region where you want to report data.
-
Record the endpoint information. In the Parameters section, set Connection Method to Alibaba Cloud Intranet and Report Method to gRPC. Then, from the Endpoint Information section, copy the gRPC endpoint address (for example,
http://tracing-analysis-dc-hz-internal.aliyuncs.com:8090) and the authentication token.NoteUse the VPC network endpoint if your NGINX Ingress Controller is deployed in the same Alibaba Cloud region as Managed Service for OpenTelemetry. Otherwise, use the public endpoint.
Step 2: Enable OpenTelemetry on NGINX Ingress ControllerManaged Service for OpenTelemetry
Log on to the ACK console. In the left navigation pane, click Clusters.
-
On the Clusters page, click the name of your cluster. In the left navigation pane, click .
-
On the Deployments page, set the Namespace to kube-system. Find the
nginx-ingress-controllerdeployment and click Edit in the Actions column. -
On the Edit page, select the nginx-ingress-controller container. On the Environment Variable tab, click Add to add the following environment variable.
Type
Variable name
Value
Description
Custom
OTEL_EXPORTER_OTLP_HEADERS
authentication=<authentication token>Use the authentication token that you obtained in Step 1: Obtain endpoint information. Example:
authentication=bfXXXXXXXe@7bXXXXXXX1_bXXXXXe@XXXXXXX1.After the addition is complete, click Update on the right side of the Edit page, and then click OK in the dialog box that appears.
-
In the left-side navigation pane, choose Configuration > ConfigMaps.
-
On the ConfigMaps page, set the Namespace to kube-system. Find the
nginx-configurationConfigMap and click Edit in the Actions column. -
In the Edit panel, click Add to add the following key-value pairs, and then click OK.
Parameter
Description
Value
Example
enable-opentelemetry
Specifies whether to enable OpenTelemetry tracing.
-
true: Enables tracing.
-
false: Disables tracing.
truemain-snippet
-
env OTEL_EXPORTER_OTLP_HEADERS;env OTEL_EXPORTER_OTLP_HEADERS;otel-service-name
The service name.
A custom name.
nginx-ingress
otlp-collector-host
The domain name of the gRPC reporting endpoint.
Use the VPC network endpoint that you obtained in Step 1: Obtain endpoint information. Remove the
http://prefix and the port number. Example:tracing-analysis-XX-XX-XXXXX.aliyuncs.com.tracing-analysis-XX-XX-XXXXX.aliyuncs.comotlp-collector-port
The port of the gRPC reporting endpoint.
The actual port number.
8090opentelemetry-trust-incoming-span
Specifies whether to trust incoming traces from other services or systems.
-
true: Trusts incoming traces.
-
false: Does not trust incoming traces.
trueopentelemetry-operation-name
The format of the trace span.
HTTP $request_method $service_name $uriHTTP $request_method $service_name $uriotel-sampler
The sampling rule.
For more information, see the NGINX Ingress Controller documentation.
TraceIdRatioBased
otel-sampler-ratio
The sample rate.
A value from 0.0 to 1.0, with up to two decimal places. A value of 0.0 disables sampling, while 1.0 samples every trace.
For more information, see the NGINX Ingress Controller documentation.
0.1
otel-sampler-parent-based
Specifies whether to inherit the sampling decision from the upstream service.
-
false: (Default) Does not inherit the upstream sampling decision. The
otel-samplerandotel-sampler-ratioparameters take effect. -
true: Inherits and reuses the upstream sampling decision. The
otel-samplerandotel-sampler-ratioparameters do not take effect.
For more information, see the NGINX Ingress Controller documentation.
false
-
Step 3: View traces in the ARMS console
-
Log on to the ARMS console. In the left-side navigation pane, choose .
-
On the Application List page, select a region from the drop-down list at the top. Then, click the nginx-ingress application name.
-
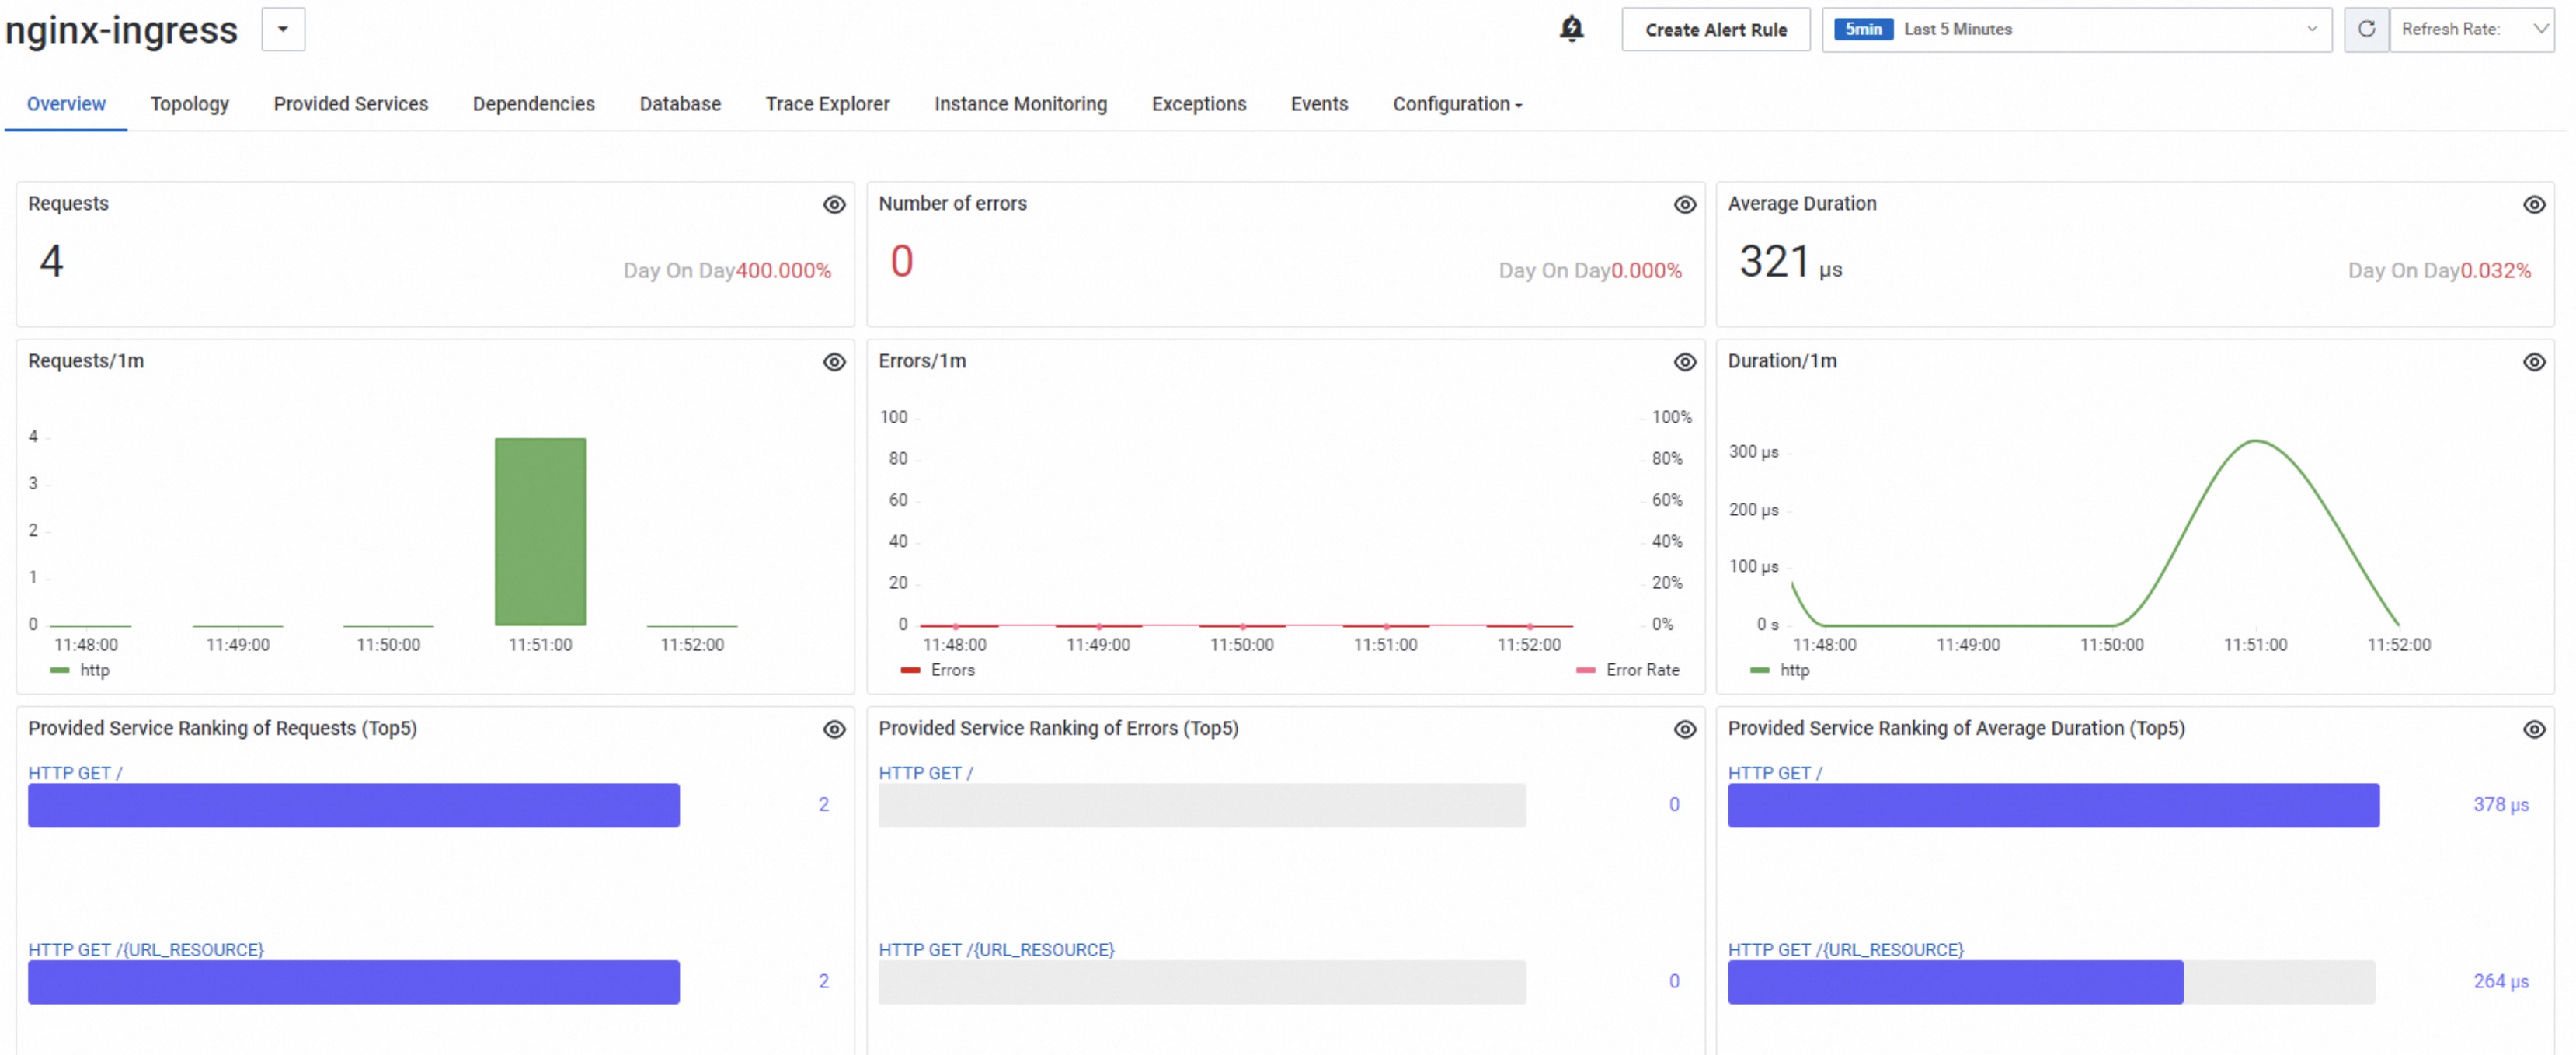
Explore the trace information on the application details page.
-
On the Application Overview tab, view metrics such as the number of requests and errors.
-
On the Trace Explorer tab, you can view charts for the number of calls, errors, and duration at the top of the page. Below the charts, a list of traces is displayed with columns such as TraceId, span name, application name, Duration, and Status (for example,
200or404). -
From the trace list on the Trace Explorer tab, click a TraceId to open its details page. This page shows a timeline view and detailed information for each span, including the application name (for example, nginx-ingress), operation name (for example, HTTP GET my-nginx-svc /), start and end times, and duration. The Attributes tab displays HTTP attributes such as
http.method,http.status_code,http.host, andhttp.user_agent, and network information such asnet.host.port.
-
OpenTracing
Step 1: Obtain endpoint information
-
Log on to the ARMS console. In the left-side navigation pane, click Integration Center.
-
In the Server-side Applications area, click the Zipkin card.
NoteThis example uses Zipkin.
-
In the Zipkin panel that appears, select the region where you want to report data.
-
Record the endpoint information. For Connection Method, select Alibaba Cloud Intranet. The page displays two VPC network endpoint URLs: a v2 endpoint and a v1 endpoint. Copy the URL of the v1 endpoint for later use.
NoteUse the VPC network endpoint if your NGINX Ingress Controller is deployed in the same Alibaba Cloud region as Managed Service for OpenTelemetry. Otherwise, use the public endpoint.
Step 2: Enable OpenTracing on NGINX Ingress ControllerManaged Service for OpenTelemetry
Log on to the ACK console. In the left navigation pane, click Clusters.
On the Clusters page, click the name of your cluster. In the left navigation pane, click .
-
On the ConfigMaps page, set the Namespace to kube-system. Find the
nginx-configurationConfigMap and click Actions in the Edit column. -
In the Edit panel, click Add to add the following key-value pairs, and then click OK.
Parameter
Description
Value
Example
enable-opentracing
Specifies whether to enable tracing.
-
true: Enables tracing.
-
false: Disables tracing.
true
zipkin-service-name
The service name.
A custom name.
nginx-ingress
zipkin-collector-host
The domain name of the reporting endpoint.
Modify the endpoint URL that you obtained in Step 1: Obtain endpoint information. Remove the
http://prefix and add a question mark (?) to the end. For example:-
Original endpoint:
http://tracing-analysis-dc-hz-internal.aliyuncs.com/adapt_******_******/api/v1/spans. -
Modified value:
tracing-analysis-dc-hz-internal.aliyuncs.com/adapt_******_******/api/v1/spans?.
tracing-analysis-dc-hz-internal.aliyuncs.com/adapt_******_******/api/v1/spans?opentracing-trust-incoming-span
Specifies whether to trust incoming traces from other services or systems.
-
true: Trusts incoming traces.
-
false: Does not trust incoming traces.
true
zipkin-sample-rate
The sample rate.
A value from 0 to 1, with up to two decimal places. A value of 0 means no sampling, and 1 means all data is sampled.
0.1
-
Step 3: View traces in the ARMS console
-
Log on to the ARMS console. In the left-side navigation pane, click .
-
On the Application List page, select a region from the drop-down list at the top. Then, click the application name nginx.
-
In the left-side navigation pane of the application details page, click Interface Invocation.
-
The Overview tab displays the service topology and call relationships for the current application. Other available tabs include Upstream, Downstream, and Traces.
-
The Traces tab lists up to 100 of the application's longest-running traces. For more information about trace data, see Interface Invocation. The table includes columns such as Time, span name, Host/IP, Duration, Status, TraceId, and Actions. You can filter the results by Duration greater than and Exception.
-
On the Traces tab, click a TraceId to view the trace details. The Trace Details page shows the TraceId, start time, and total duration. It also displays a waterfall chart that visualizes the hierarchy and relative duration of each span. For example, a request to
/api/currencymight pass through services such asnginx-otlp,frontendproxy,frontend, andcurrencyservice, with a total duration of approximately 15 ms. Each span is represented by a horizontal bar that indicates its duration relative to the entire trace.
-
(Optional) Switch the OpenTelemetry propagator
By default, when using the OpenTelemetry method, the NGINX Ingress Controller propagates trace context in the W3C Trace Context format. If your frontend and backend applications use other context formats, such as B3 (used by Zipkin) or Jaeger, you must change the propagator to ensure traces are linked correctly across all services. This section describes how to change the propagator for the NGINX Ingress Controller.
-
Add the
OTEL_PROPAGATORSenvironment variable using the same method described in Step 2.4 of the OpenTelemetry procedure. Then, save the configuration and redeploy thenginx-ingress-controller.Environment variable
Value
Description
OTEL_PROPAGATORS
tracecontext,baggage,b3,jaeger
A comma-separated list of propagators to use. For more information, see Specify the format of propagation headers for OpenTelemetry.
-
Next, modify the
main-snippetconfiguration as described in Step 2.7 of the OpenTelemetry procedure to apply theOTEL_PROPAGATORSenvironment variable.Parameter
Value
Description
main-snippet
env OTEL_EXPORTER_OTLP_HEADERS; env OTEL_PROPAGATORS;
Loads the environment variables.
References
-
For more information about Managed Service for OpenTelemetry, see What is Managed Service for OpenTelemetry?.
-
For more information about ACK, see What is Container Service for Kubernetes (ACK)?.
-
The required keys in the
nginx-configurationConfigMap vary depending on the tracing tool used (for example, Zipkin, Jaeger, or SkyWalking). For more information about how to connect to Managed Service for OpenTelemetry, see Preparations.