Managed Service for Prometheus provides a standard Prometheus Remote Read endpoint. Add this endpoint to the remote_read block in your self-managed Prometheus configuration to query time series data stored in Alibaba Cloud.
Remote Read transfers raw time series data to your local Prometheus for PromQL evaluation. Every query pulls unprocessed data across the network before computation begins, because all PromQL evaluation happens locally -- not on the server. This architectural constraint means Remote Read:
Requires you to maintain a local Prometheus compute engine, which incurs high infrastructure costs.
Adds network latency proportional to the data volume, as each data pull traverses multiple network layers.
Is subject to service limits that are easily exceeded when handling large data volumes.
Managed Service for Prometheus also provides a full Prometheus HTTP API that evaluates queries server-side and returns only the results -- delivering tens of times better performance compared to Remote Read followed by local computation. No local compute engine is required. You can send queries directly over HTTP and connect Grafana directly.
Choose Remote Read only when your workflow requires a local Prometheus instance to merge cloud and on-premises data into a single query.
Limitations
The Remote Read endpoint does not support HTTP/2.
Remote Read has many service limits. These limits are easily exceeded when handling large data volumes.
Prerequisites
A Managed Service for Prometheus instance. To create one, see Create an instance.
A running self-managed Prometheus server. For installation instructions, see the Prometheus download page.
(Optional) Step 1: Grant CloudMonitor permissions to a RAM user
Skip this step if you access the Prometheus instance with an Alibaba Cloud account (not a RAM user).
If the Prometheus instance was created by an Alibaba Cloud account and you plan to use a RAM user's AccessKey pair for remote read and write access, grant the RAM user read and write permissions for CloudMonitor first.
Log on to the RAM console with your Alibaba Cloud account or as a RAM administrator. In the left navigation pane, choose .
On the Authorization page, click Grant Permission and configure the following settings.
Parameter Description Resource Scope Select the scope based on your needs. Principal Select the RAM user to authorize. Access Policy Attach one of the following policies: AliyunCloudMonitorFullAccess-- Full CloudMonitor permissions (view, edit, and delete across all sub-products).AliyunCloudMonitorReadOnlyAccess-- Read-only CloudMonitor permissions (view only).
Click Confirm, then click Close.
Step 2: Get the Remote Read endpoint
Log on to the CloudMonitor console. In the left navigation pane, choose .
In the top menu bar, select the region of your Prometheus instance. In the Actions column, click Settings.
On the Settings tab, copy the Remote Read address.
Endpoint type When to use Public endpoint Your self-managed Prometheus is outside Alibaba Cloud or in a different region. Internal endpoint Your self-managed Prometheus runs on an ECS instance in the same region. Internal traffic avoids public network latency and bandwidth charges. 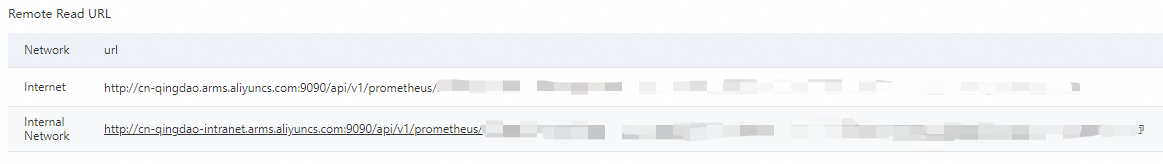
Step 3: Configure self-managed Prometheus
Edit prometheus.yml on your self-managed Prometheus server. Add the remote_read block at the end of the file, replacing the placeholder URL with the endpoint from Step 2.
global:
  scrape_interval: 15s
  evaluation_interval: 15s

scrape_configs:
  - job_name: 'prometheus'
    static_configs:
      - targets: ['localhost:9090']

remote_read:
  - url: "<your-remote-read-endpoint>"
    read_recent: true
Replace the following placeholder with your actual value:
| Placeholder | Description | Example |
|---|---|---|
<your-remote-read-endpoint> | The Remote Read endpoint copied from the CloudMonitor console | http://ts-xxxxxxxxxxxx.hitsdb.rds.aliyuncs.com:3242/api/prom_read |
Save the file and restart Prometheus for the changes to take effect.
Verify the configuration
Open the self-managed Prometheus web UI in a browser:
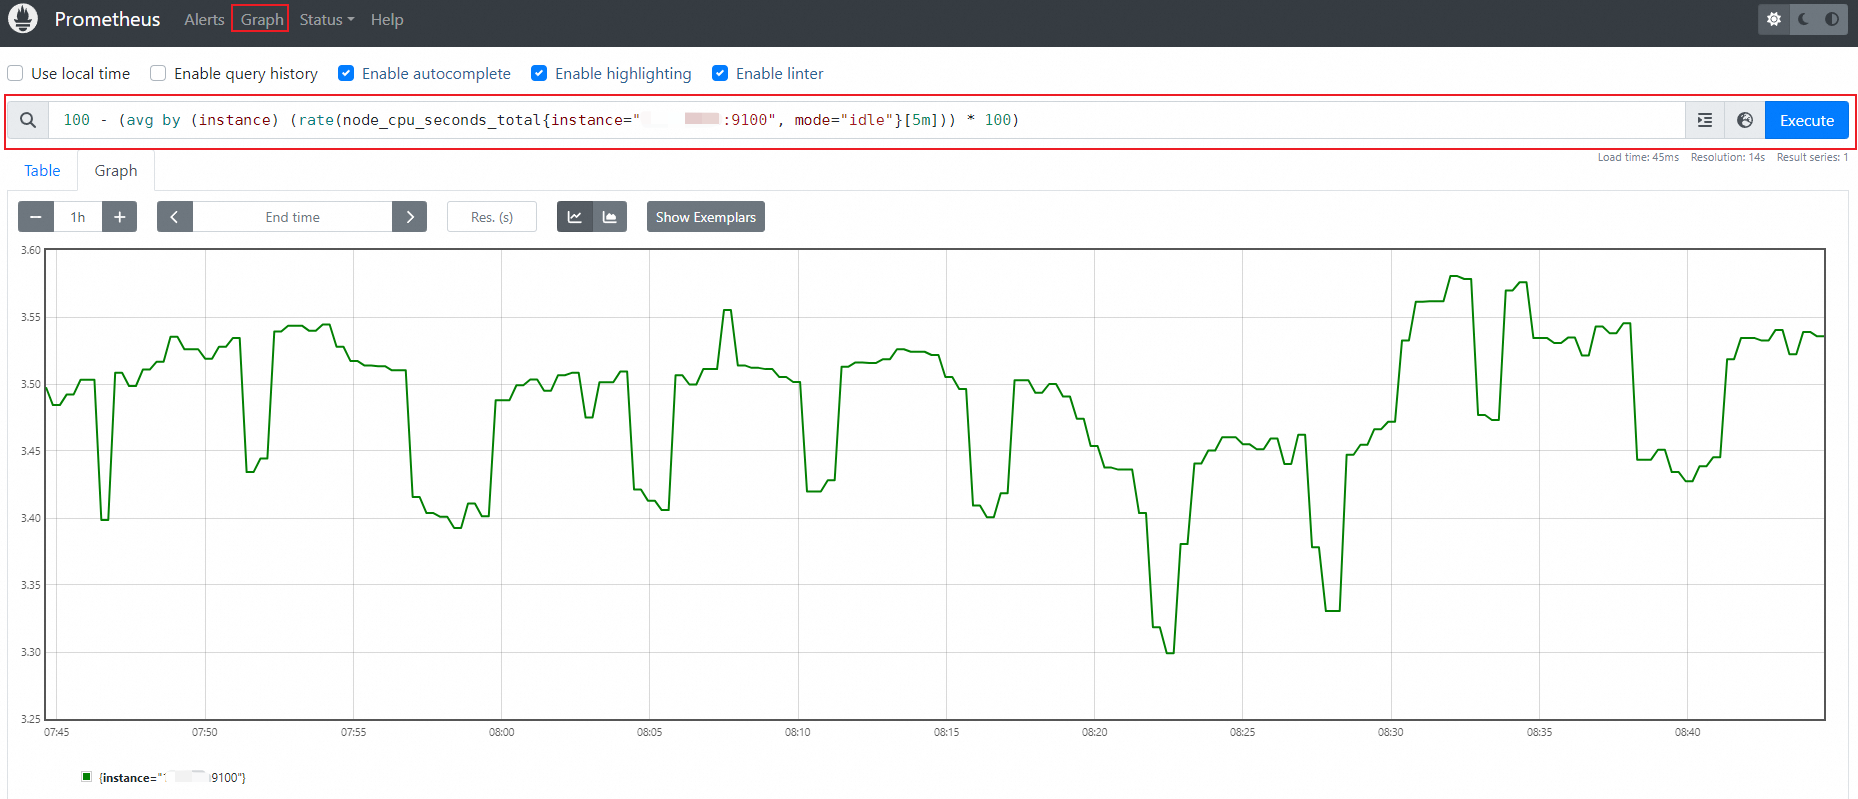
http://localhost:9090Click Graph in the top menu bar.
Enter a PromQL query and click Execute. For example, to query CPU usage for a specific host:
100 - (avg by (instance) (rate(node_cpu_seconds_total{instance="<IP>:9100", mode="idle"}[5m])) * 100)If Remote Read is configured correctly, the query results include metrics from your Alibaba Cloud Prometheus instance.
FAQ
No data after configuring Remote Read, and no errors
This typically happens when the local Prometheus configuration contains an external_labels block. The external_labels values are appended to every Remote Read request as label matchers, which can filter out all remote data if the cloud-side metrics do not carry those labels.
Remove or comment out external_labels in your prometheus.yml, then restart Prometheus:
global:
  scrape_interval: 15s
  evaluation_interval: 15s
  # external_labels:        <-- Remove or comment out this block
  #   monitor: 'my-cluster'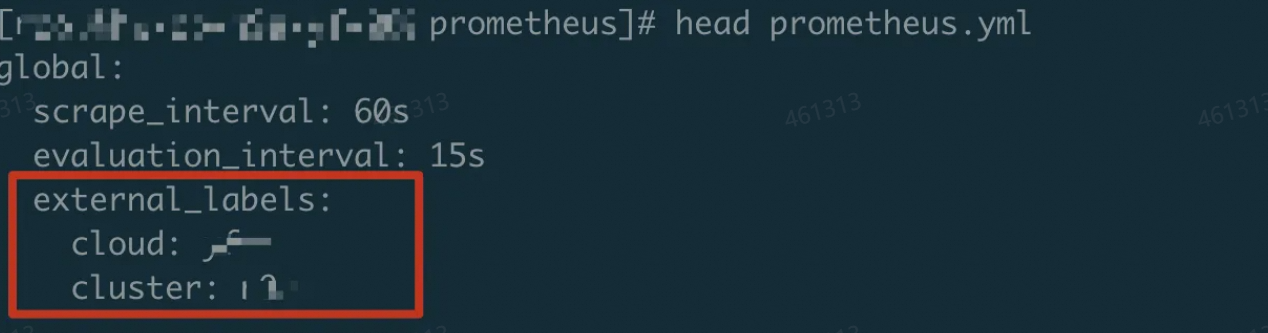
For Prometheus V1 instances, Remote Read does not require an AccessKey. If you are using a V1 instance and see no data, external_labels is the most likely cause.
What's next
Use an HTTP API endpoint to connect Grafana or a self-managed application to Prometheus data -- Query metrics server-side for faster performance and direct Grafana integration.
Service limits -- Review the quotas and limits that apply to Remote Read queries.