When your application exposes multiple service interfaces across distributed components, identifying which interface degrades performance or produces errors requires aggregated, filterable metrics. The Provided Services page in Application Real-Time Monitoring Service (ARMS) displays all services your application provides within a business trace, with RED metrics (rate, errors, and duration) for each interface. Filter by call type, interface, instance, or application, compare metrics across time periods, and drill into interface-level details or trace data.
Prerequisites
Before you begin, make sure that you have:
Open the Provided Services page
Log on to the ARMS console.
In the left-side navigation pane, choose Application Monitoring > Business Trace Explorer.
Select a region in the top navigation bar, and then click the target business trace.
Click the Provided Services tab.
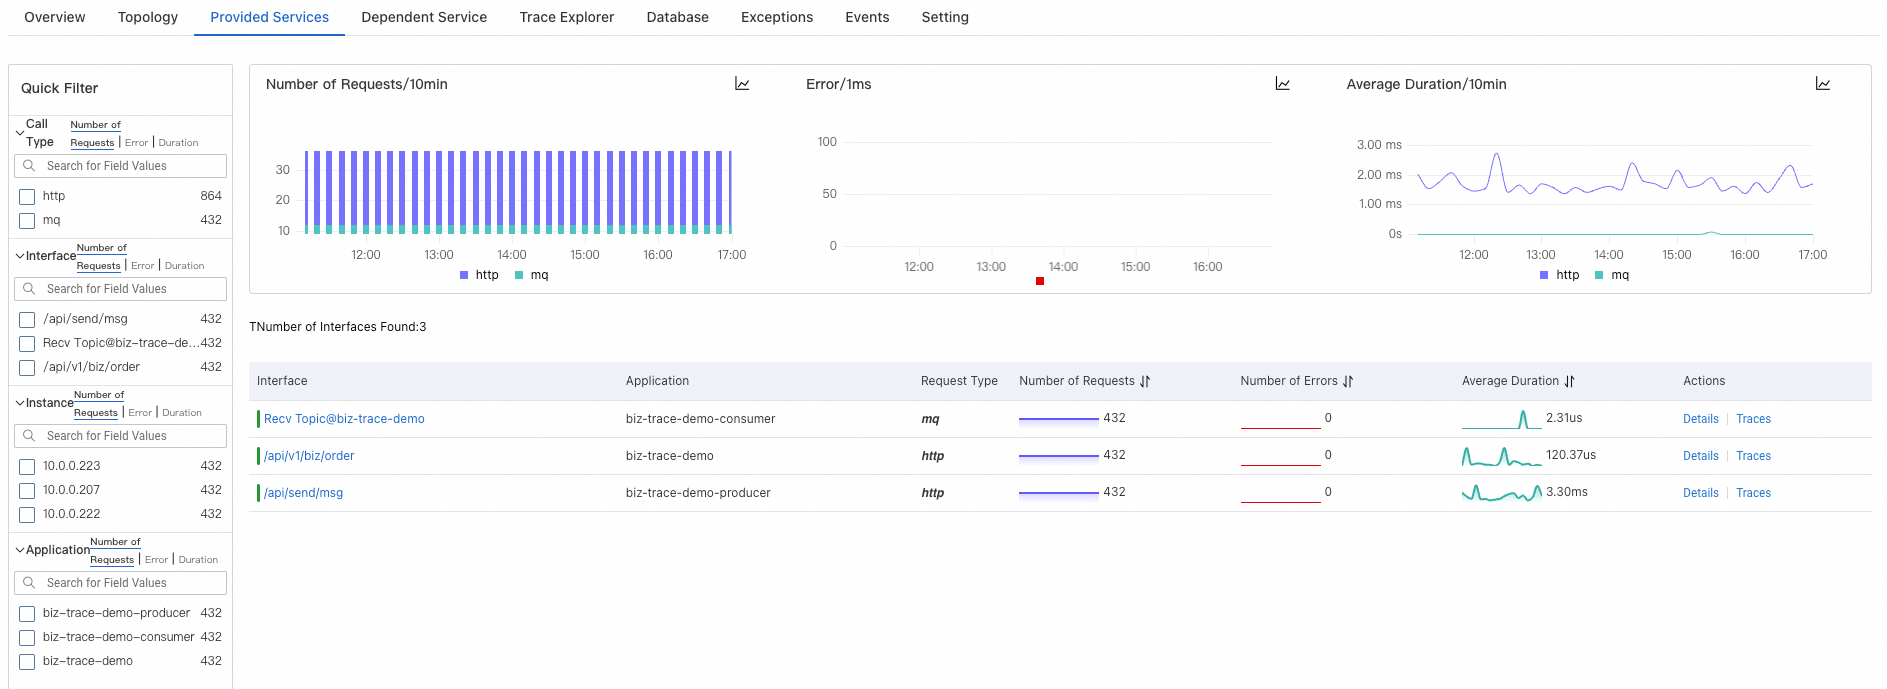
Filter services
Use the Quick Filter section to narrow the trend charts and service list by the following dimensions:
| Dimension | Description |
|---|---|
| Call type | Type of the call |
| Interface | Interface to filter by |
| Instance | Individual application instance |
| Application | Application that the interface belongs to |
Filters apply to both the trend charts and the service list.
Analyze trend charts
The trend charts display time-series data for three RED metrics:
| Metric | Description |
|---|---|
| Requests | Number of requests over time |
| Errors | Number of errors over time |
| Average response time | Average response time per request over time |
Compare metrics across time periods
Click the
 icon on a chart.
In the dialog box, select a time range to inspect, or choose dates for a side-by-side comparison.
Use time-period comparison to identify regressions after deployments or correlate spikes with specific events.
Switch chart types
Toggle between visualization formats to suit different analysis needs:
| Icon | Format | When to use |
|---|---|---|
| Column chart | Compare discrete time intervals | |
| Trend chart | Observe continuous patterns over time |
Explore the service list
The service list provides a tabular view of all monitored interfaces with the following columns:
| Column | Description |
|---|---|
| Interface | Interface name |
| Application | Application that the interface belongs to |
| Query type | Type of the call |
| RED metrics | Rate, errors, and duration for each interface |
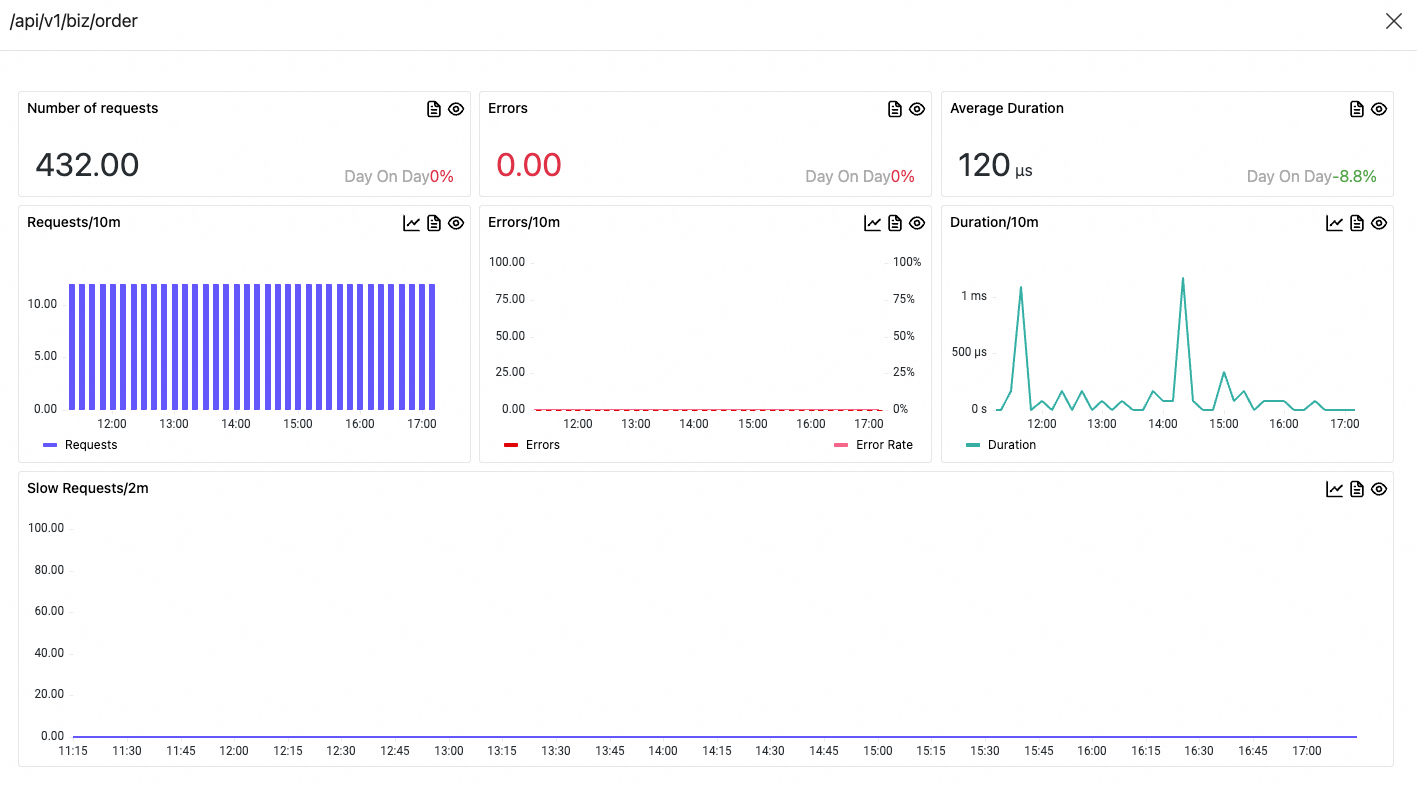
View interface details
Click an interface name, or click Details in the Actions column, to open a detail panel. The panel displays time-series charts for the following metrics scoped to the selected interface:
| Metric | Description |
|---|---|
| Request count | Number of requests received by the interface |
| Error count | Number of errors |
| Average response time | Average response time per request |
View trace details
Click Traces in the Actions column to open the trace details page.
Related topics
Create a business trace to start monitoring your application services
Analyze traces to identify performance bottlenecks across service calls