After you create a business trace, Application Real-Time Monitoring Service (ARMS) monitors the trace data. Use the Trace Explorer to search, filter, and inspect traces and spans across your services -- whether you are diagnosing a slow request, tracking down an error, or analyzing call patterns.
A typical troubleshooting workflow looks like this:
Open the Trace Explorer and set a time range that covers the incident.
Filter traces by error state, high latency, or a specific service name.
Click a trace ID to view the call topology and identify the span where the error or bottleneck originated.
Check span details and associated logs to pinpoint the root cause.
Prerequisites
Before you begin, make sure that you have:
A business trace configured in ARMS
Open Trace Explorer
Log on to the ARMS console.
In the left-side navigation pane, choose Application Monitoring > Business Trace Explorer.
Select a region in the top navigation bar, then click the business trace that you want to analyze.
Click the Trace Explorer tab.
Filter traces
Set a time range in the upper-right corner of the Trace Explorer page, then narrow down results with one or more of the following methods:
Quick Filter: Filter by state, time consumed, application name, interface name, or host address in the Quick Filter section on the left.
Search bar: Click the search bar at the top and select a predefined filter condition from the drop-down list, or add a custom condition.
Query statement: Enter a query statement in the search box at the top right.
Click the  icon next to the search box to save the current filter conditions. To reuse a saved filter, click Saved View next to the search box and select a saved condition.
After filtering, specify an aggregation dimension to group the results. For example, aggregate by application name or interface name to compare performance across services.
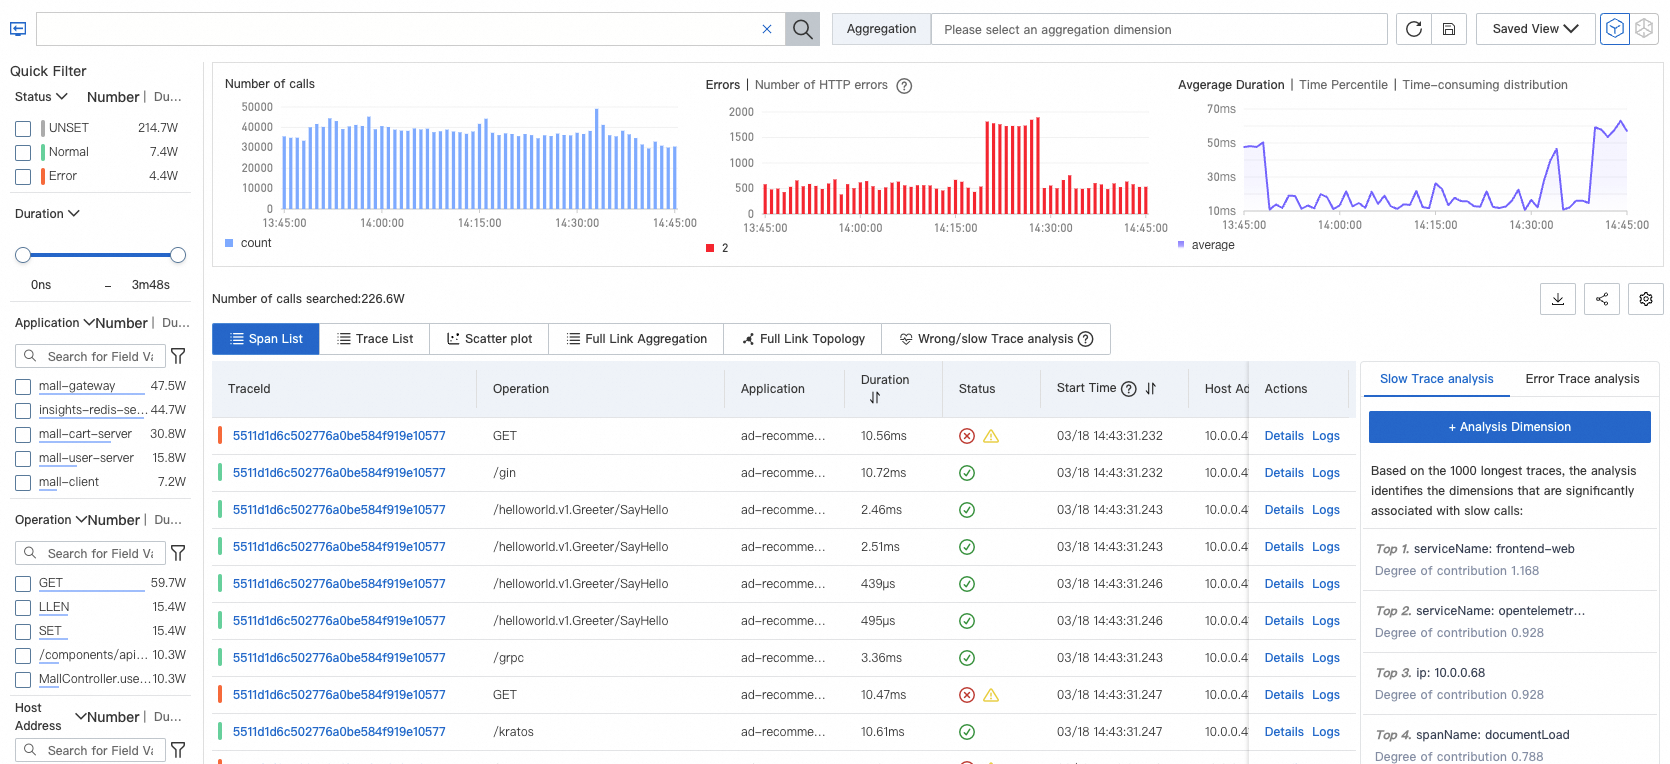
Understand the trace list
After you apply filters, the Trace Explorer page displays results in three sections:
| Section | Description | Use case |
|---|---|---|
| Bar charts | Call counts and HTTP error distribution over time | Spot spikes in errors or traffic |
| Time series curve | Span duration over time | Identify latency trends or outliers |
| Span and trace lists | Individual trace records with metadata | Drill into specific requests |
Status indicators
The bar chart and trace list use the following indicators:
| Indicator | Meaning | Source |
|---|---|---|
 | Normal span | statusCode=1 |
 | Error span | statusCode=2 |
 | Span with exceptions | attributes.excep.ids contains a value |
| 2XX (green), 3XX (yellow), 4XX (orange), 5XX (red) | HTTP status codes in the bar chart | attributes.http.status_code or attributes.http.response.status_code |
If a span includes both a status code indicator and an HTTP status code, the HTTP status code takes precedence.
Work with the trace list
The span and trace lists support the following actions:
| Action | How |
|---|---|
| View trace details and topology | Click a trace ID, or click Details in the Actions column. See Trace details. |
| View trace logs | Click Logs in the Actions column. See Trace logs. |
| Expand all spans under a trace | Click the  icon. By default, only the root span is displayed for each trace. icon. By default, only the root span is displayed for each trace. |
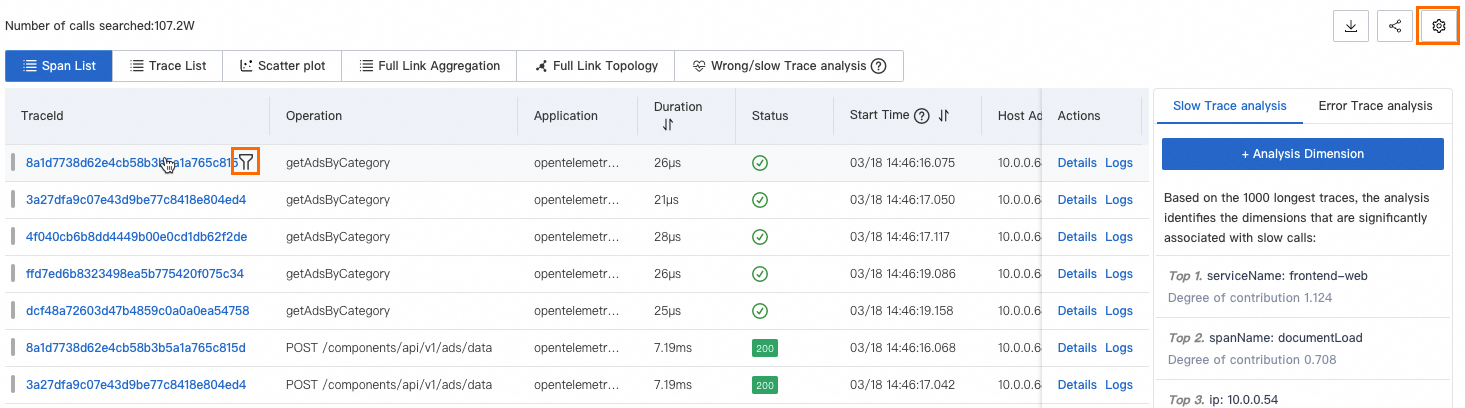
| Customize list columns | Click the  icon in the upper-right corner. icon in the upper-right corner. |
| Add a span value as a filter | Hover over a span and click the  icon. icon. |
References
For more information about the general Trace Explorer (non-business trace), see Trace analysis.