The business trace overview page displays key metrics for the trace, such as requests, error rate, and average response time.
Prerequisites
View the overview
Log on to the ARMS console. In the left-side navigation pane, choose .
On the Business Trace List page, select a region at the top of the page, and then click the name of the business trace.
In the top navigation bar, click Overview.
Dashboard
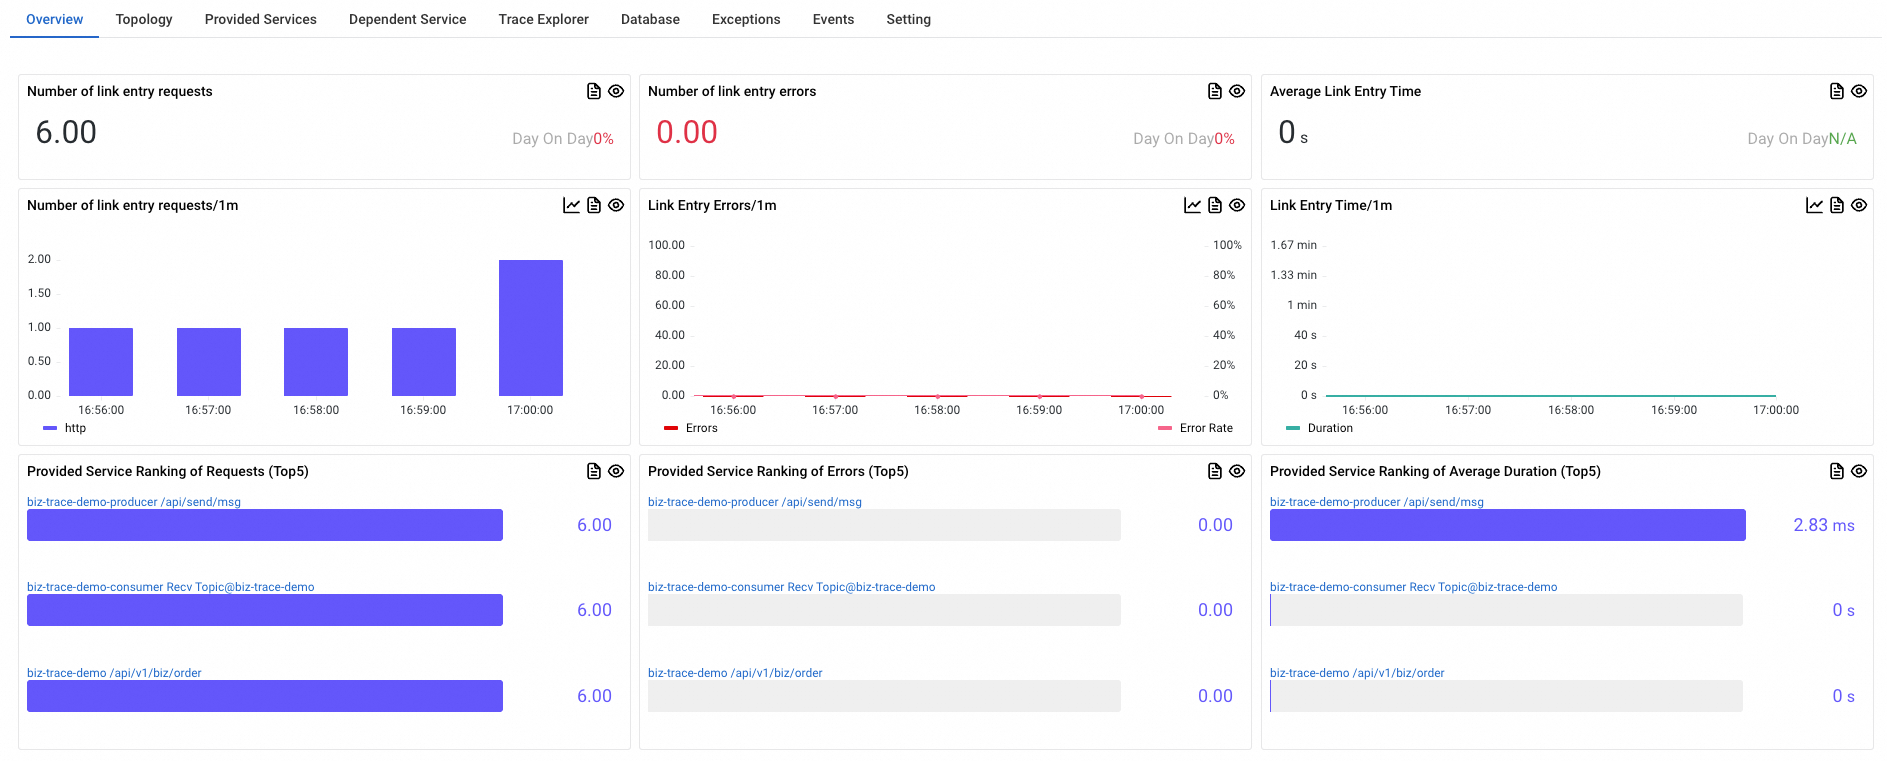
The first row displays summary cards for the selected time range: total requests, total errors, and the average response time of the business trace entry point.
The second row displays trend charts of requests, errors, and response time for the business trace entry point over the selected time range.
The third row lists the top five interfaces—from the entry point to all downstream applications—ranked by total requests, total errors, or average response time.
Panel features
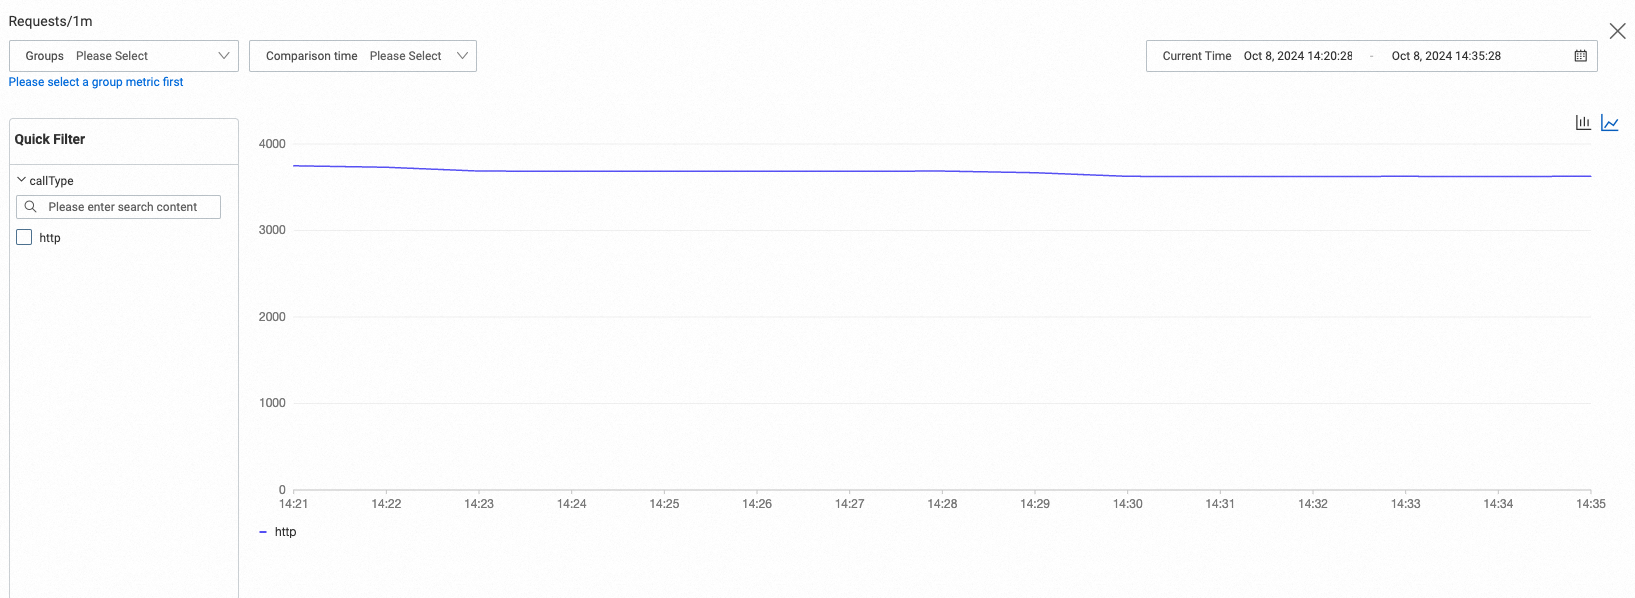
Compare data
Click the ![]() icon on a trend chart panel to compare data by group or by a previous time period.
icon on a trend chart panel to compare data by group or by a previous time period.
You can group data by basic fields or instance tags:
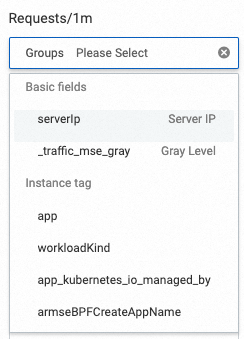
Basic fields: Common labels shared across all metrics. Currently, you can use the
serverIplabel for group comparison.Instance tag: In addition to default instance tags, you can add custom instance tags to expand your grouping options. For more information, see Add and use tags.
Compare time: Select a time period to compare with the current time period.
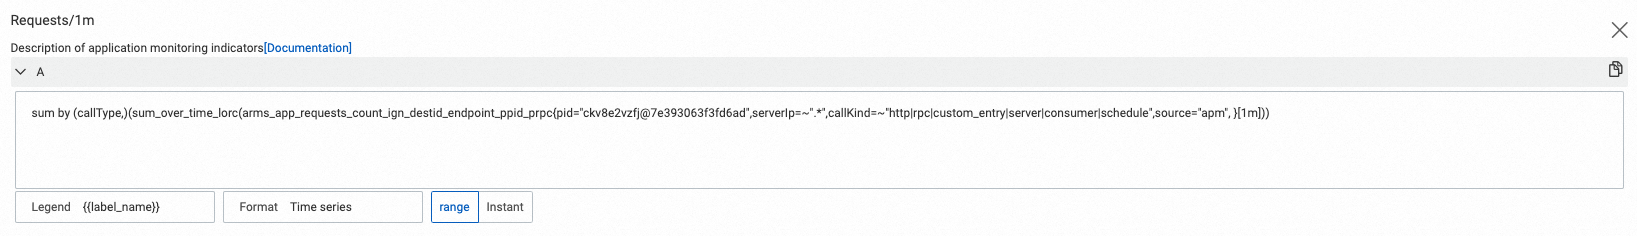
PromQL statements
Click the ![]() icon on a panel to view the underlying PromQL statement. You can use this statement in other services, such as Managed Service for Prometheus or Managed Service for Grafana, to build custom dashboards.
icon on a panel to view the underlying PromQL statement. You can use this statement in other services, such as Managed Service for Prometheus or Managed Service for Grafana, to build custom dashboards.
Run the PromQL statement on the Metrics Explorer page in the Managed Service for Prometheus console to query and visualize metrics. For more information, see Metrics Explorer.
Use the PromQL statement to configure panels when you build a custom dashboard in Managed Service for Grafana. To learn how to integrate data sources, see Manage cloud services.