After you configure a business trace, Application Real-Time Monitoring Service (ARMS) monitors the trace data. On the Dependent Services page, you'll see the dependent services of your application in the trace.
Prerequisite
View a dependent service
Log on to the ARMS console. In the left-side navigation pane, choose .
Select a region in the top navigation bar and click the business trace.
In the navigation bar at the top, click the Dependent Services tab.
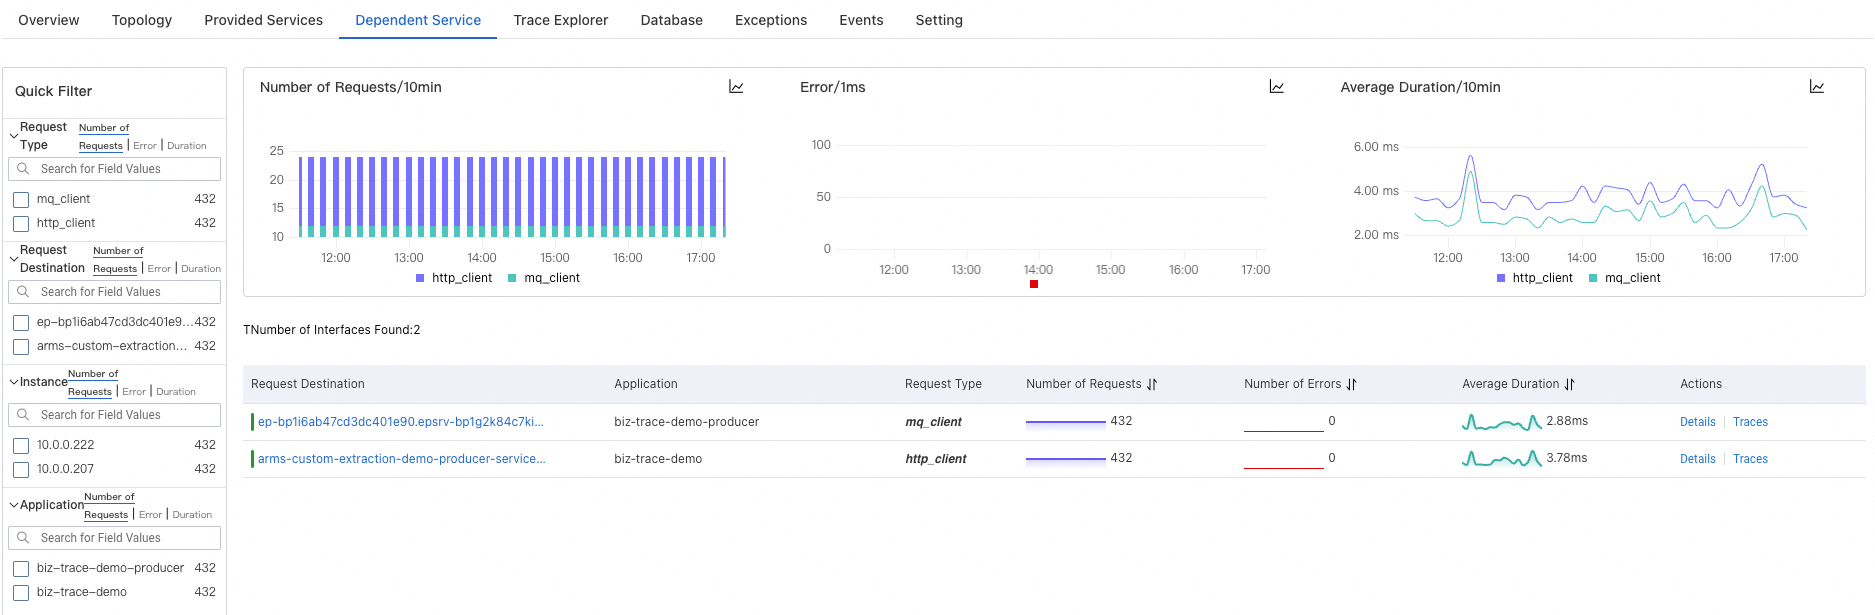
In the Quick Filter section, filter the charts and service list by request type, request target, instance, and application.
In the trend charts section, view the time series curves of the requests and errors, and average response time for a service.
First, click the
 icon. In the dialog box that appears, you can view the metric data in a specific period of time or compare the metric data during the same time period across different dates. Click the
  or
or  icon to display the data in a column chart or trend chart, respectively.
The service list displays information such as the name of the request target, associated application, request type, and RED (rate, errors, and duration) metrics.
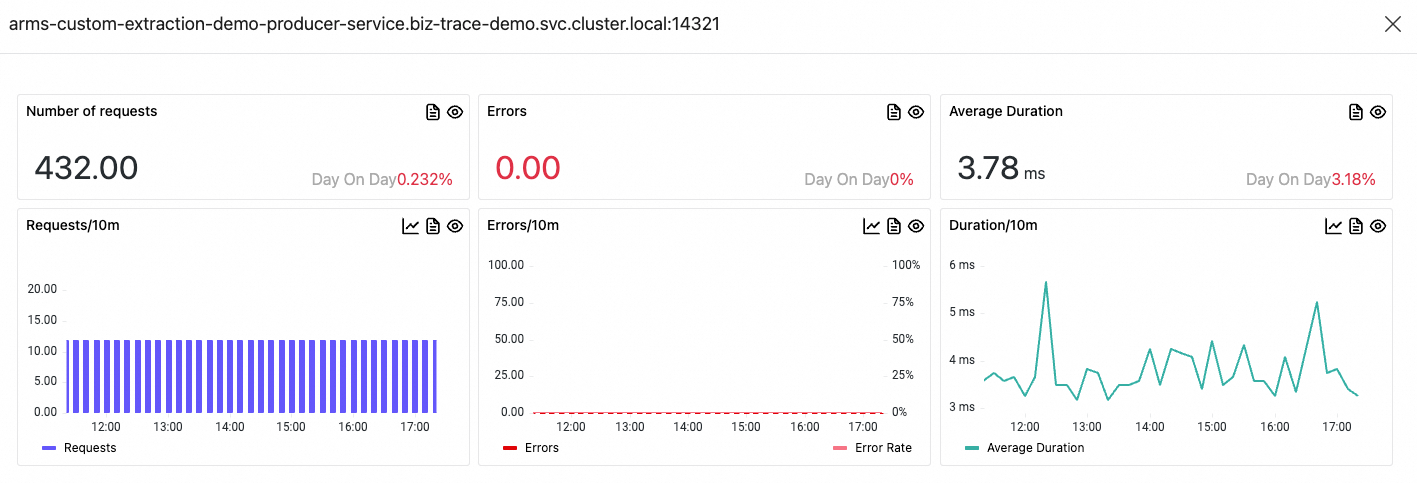
Click the name of a request target or Details in the Actions column to view information such as the number of requests, errors, and average response time of the request target.
Click Traces in the Actions column to view trace details.