Application topology
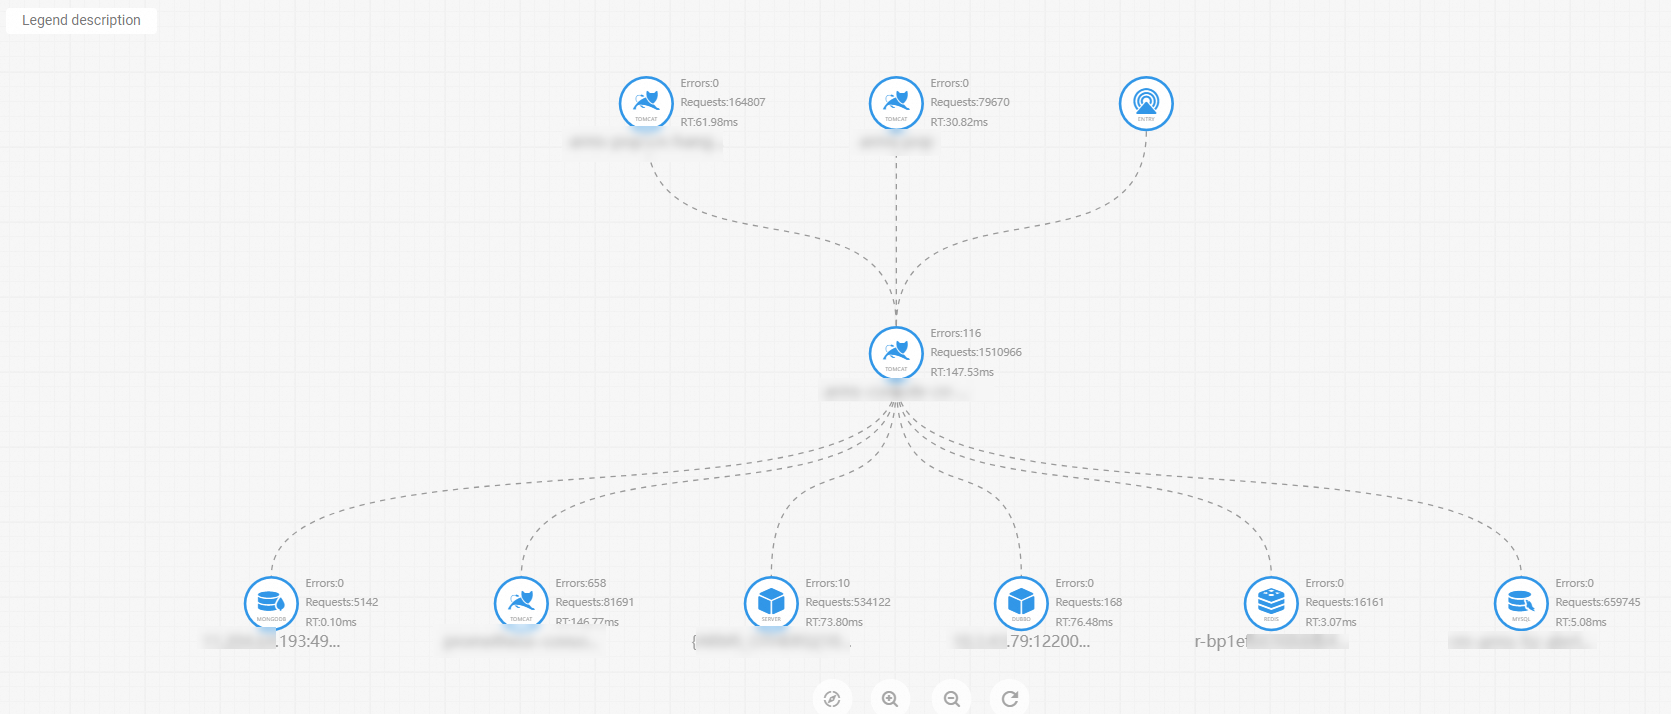
In distributed applications, a single user request often passes through multiple services. When latency spikes or errors occur, you need to quickly identify which service in the call chain is responsible. The application topology maps all service-to-service dependencies so you can trace request flows and locate root causes without manually correlating logs across services.
Prerequisites
Before you begin, make sure that you have:
An Application Real-Time Monitoring Service (ARMS) agent installed for your application. For details, see Application Monitoring overview
Application Monitoring provides a new application details page for users who have enabled the new billing mode. For details, see Billing (new). If you have not enabled the new billing mode, click Switch to New Version on the Application List page to access the new application details page.
View the application topology
Log on to the ARMS console. In the left-side navigation pane, choose Application Monitoring > Application List.
On the Application List page, select a region in the top navigation bar and click the name of the application.
NoteThe icon in the Language column indicates the monitoring source. The
 icon means the application is connected to Application Monitoring. A hyphen (-) means the application is connected to Managed Service for OpenTelemetry.
Click the Topology tab in the top navigation bar. The Application Topology tab displays the topological relationships among internal services of the application in the specified time period.