End-to-end tracing best practices
When user terminals, gateways, backend applications, and dependent services all report to a shared trace topology, you get a complete picture of how each request flows -- from a browser tap to a database query and back. Gaps in this topology are gaps in your ability to diagnose latency and failures. End-to-end tracing closes those gaps by connecting every layer of your stack under a single trace context.
Application Real-Time Monitoring Service (ARMS) and Managed Service for OpenTelemetry support end-to-end tracing across four layers:
| Layer | Examples |
|---|---|
| User terminals | Browsers, Android and iOS apps, mini programs |
| Cloud gateways | Application Load Balancer (ALB), Microservices Engine (MSE), NGINX Ingress Controller, Service Mesh (ASM) |
| Backend applications | Java, Go, Python, .NET, Node.js, and other language runtimes |
| Dependent services | Databases, message queues, large models, and 100+ other components |
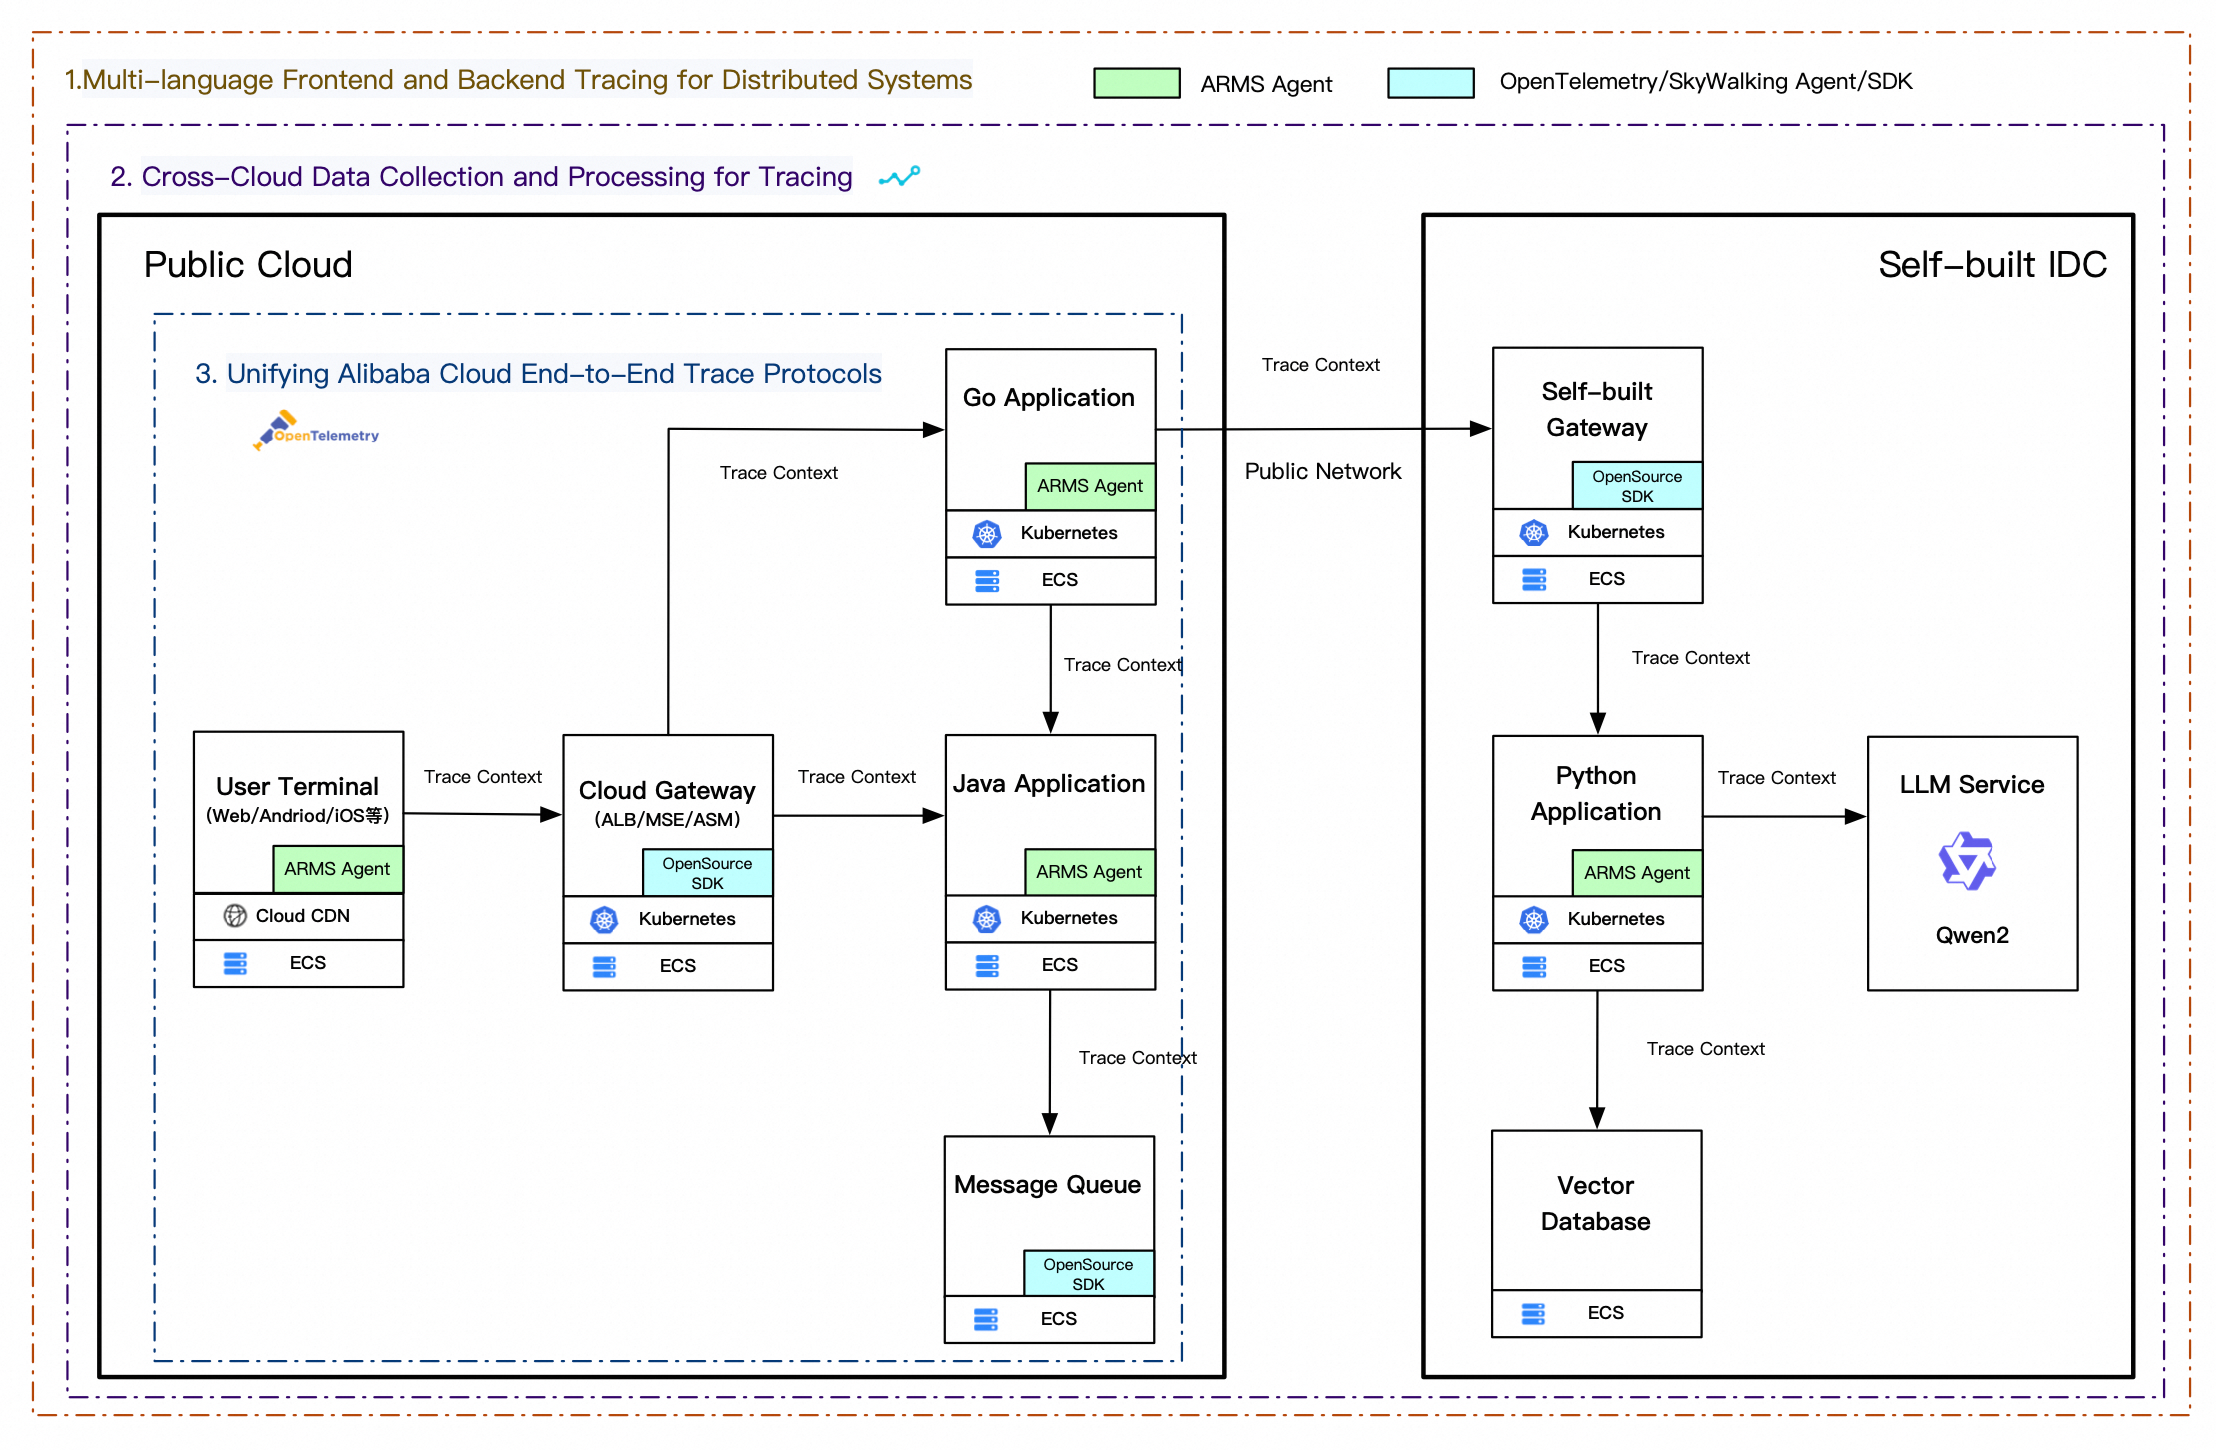
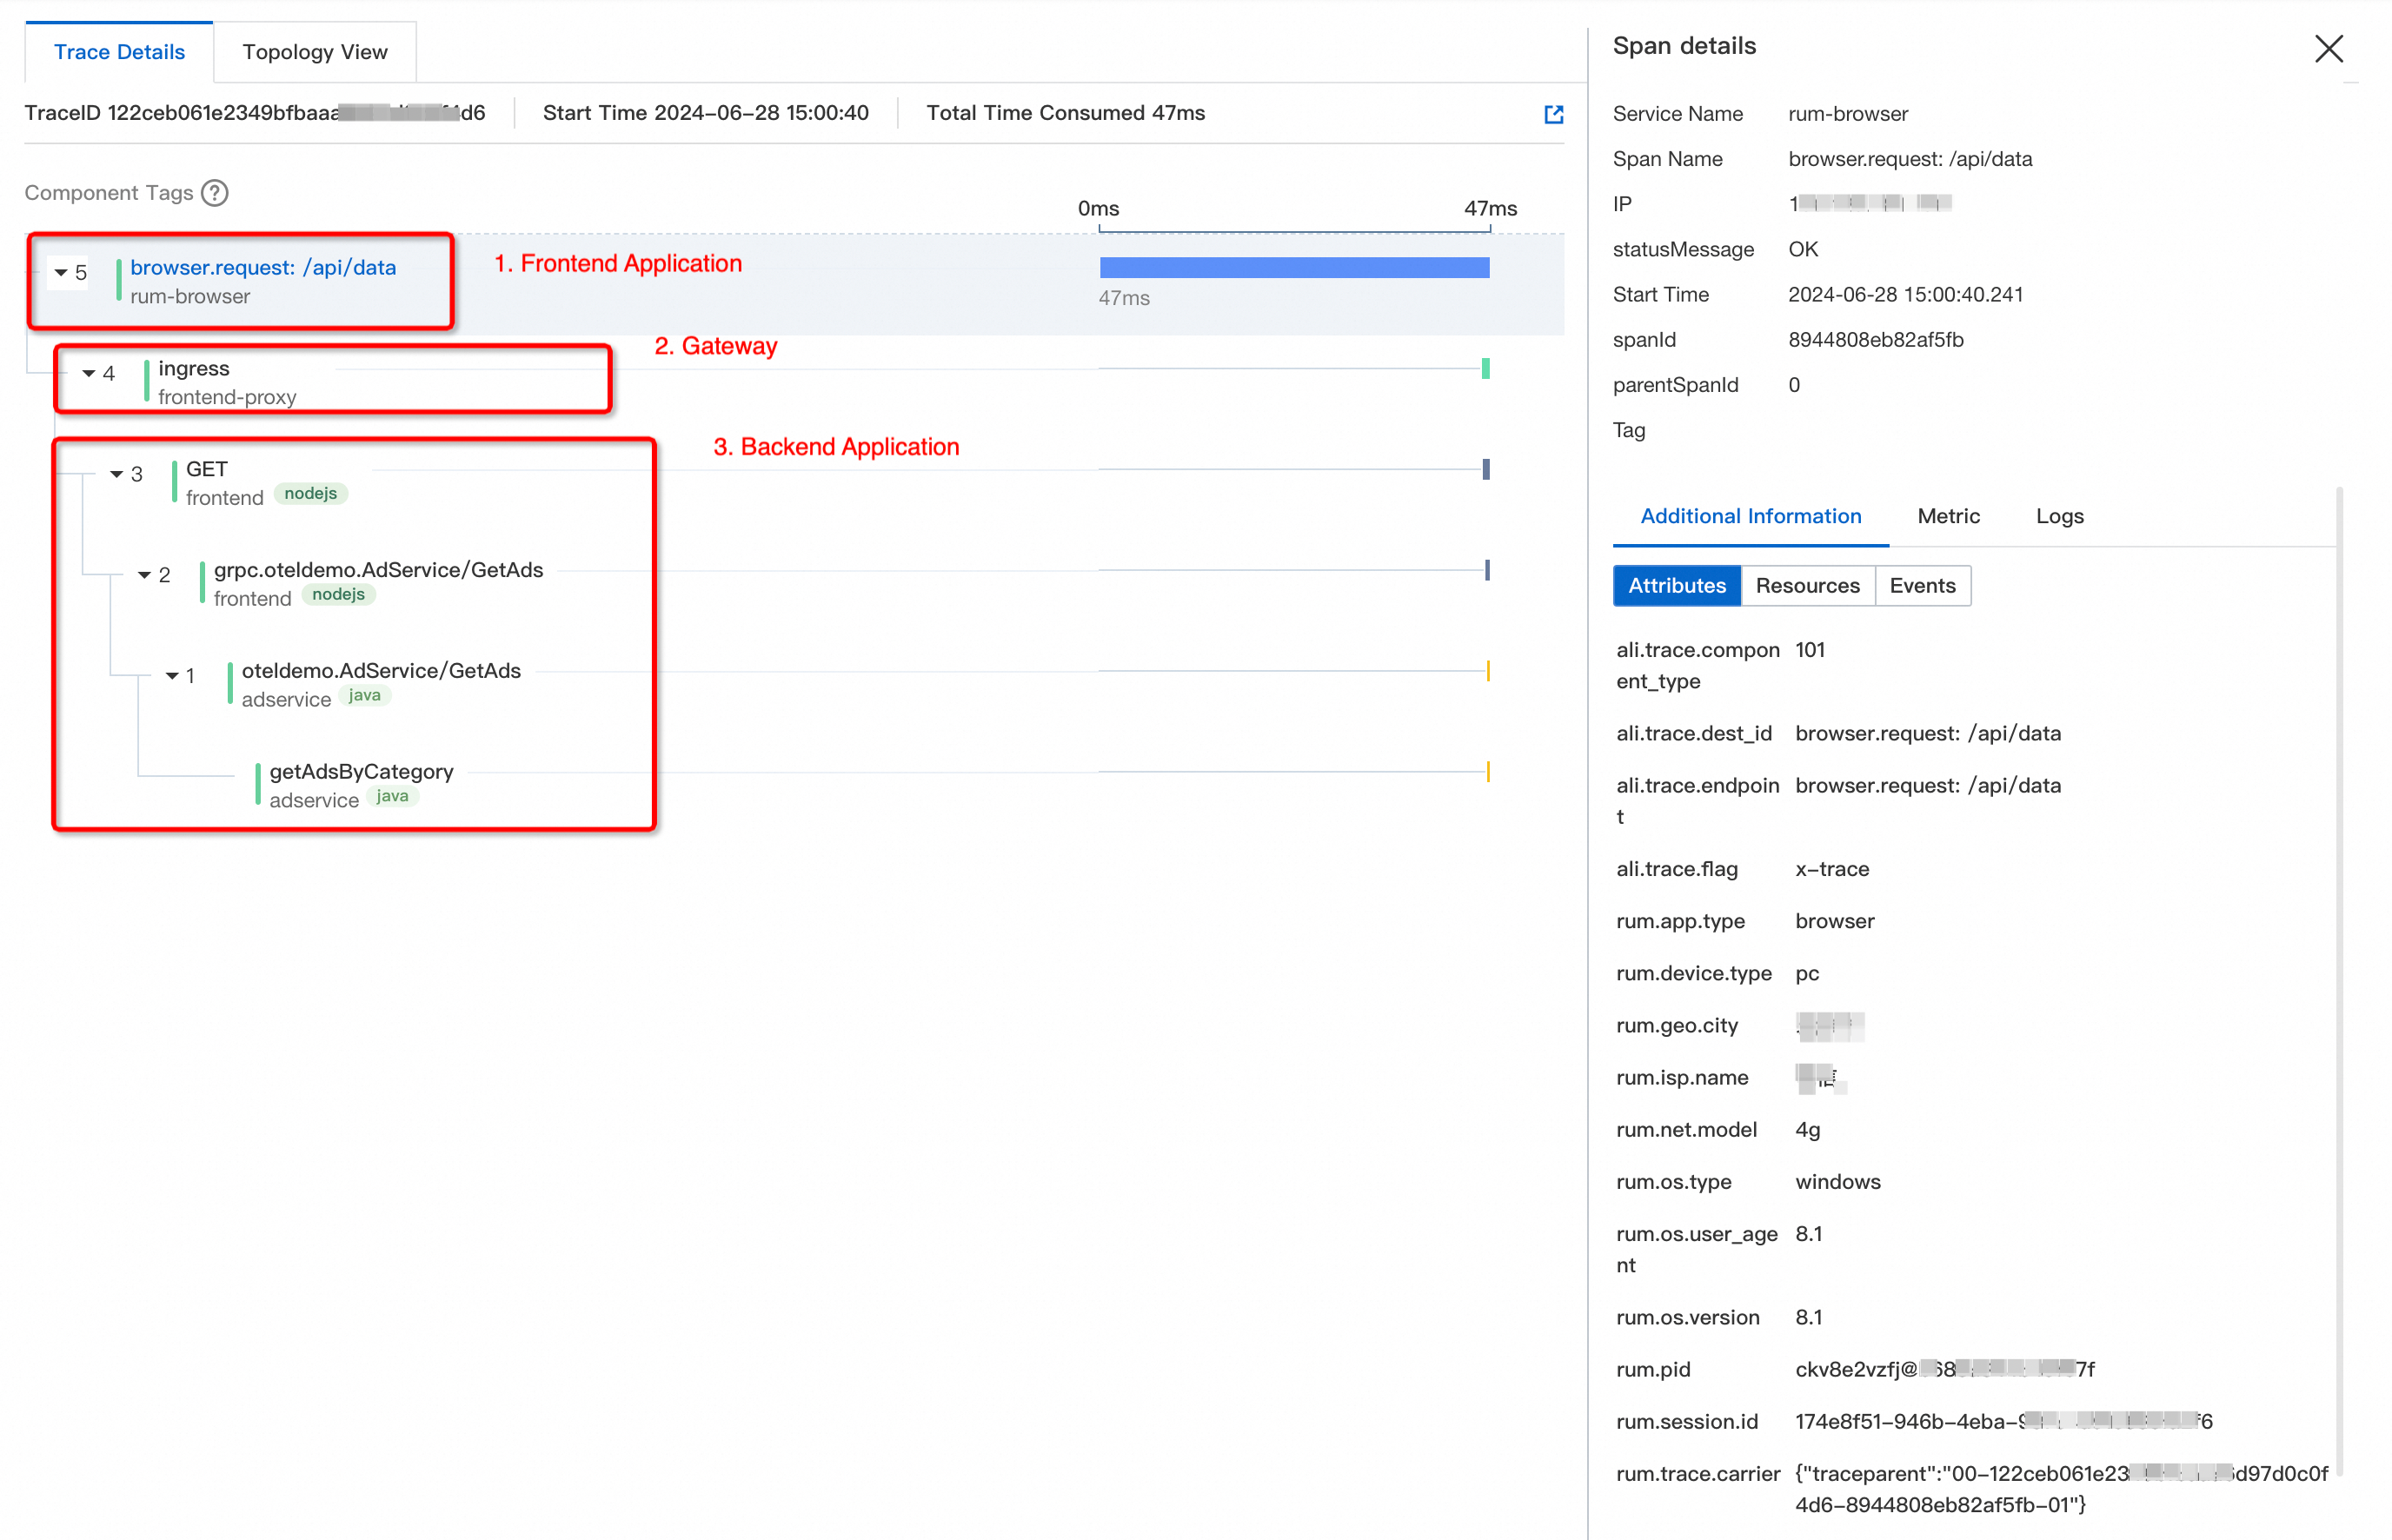
Each layer reports trace data to ARMS or Managed Service for OpenTelemetry. A shared trace context -- typically W3C Trace Context -- propagates across service boundaries, stitching individual spans into a unified trace.
Instrument your applications
Select the right SDK
ARMS provides two instrumentation paths. Use them together in multi-language environments -- they are fully interoperable.
ARMS Application Monitoring -- Self-developed agent with guaranteed SLA for Java, Go, and Python. Delivers deeper diagnostics, flexible sampling policies, agent self-monitoring, and dynamic feature degradation.
Managed Service for OpenTelemetry -- Supports 10+ languages through open-source clients (OpenTelemetry, SkyWalking, Zipkin, and Jaeger). You manage the client configuration.
| Language | ARMS Application Monitoring | Managed Service for OpenTelemetry | Recommended |
|---|---|---|---|
| Java | Automatic instrumentation | Automatic instrumentation | ARMS |
| Go | Automatic instrumentation | Automatic instrumentation | ARMS |
| Python | Automatic instrumentation | Automatic instrumentation | ARMS |
| Node.js | -- | Automatic instrumentation | OpenTelemetry |
| .NET | -- | Automatic instrumentation | OpenTelemetry |
| PHP | -- | Automatic instrumentation | OpenTelemetry |
| Erlang | -- | Automatic instrumentation | OpenTelemetry |
| C++ | -- | Manual instrumentation | OpenTelemetry |
| Swift | -- | Manual instrumentation | OpenTelemetry |
| Ruby | -- | Manual instrumentation | OpenTelemetry |
| Rust | -- | Manual instrumentation | SkyWalking |
ARMS agent for Java v4.0
The ARMS agent for Java v4.0, released in 2024, is built on the OpenTelemetry framework. Beyond standard trace data, it captures resource metrics, performance diagnostics, and application security data. Capabilities include:
Flexible trace sampling policies
User-friendly agent management
Comprehensive agent self-monitoring
Dynamic feature degradation for production stability
Integrate Alibaba Cloud services
A major challenge for enterprises moving to the cloud is their heavy reliance on cloud service availability. End-to-end tracing can quickly pinpoint slow or failed request nodes, improving fault recovery and reducing business losses.
Managed Service for OpenTelemetry integrates with nearly 10 Alibaba Cloud services. For most services, enable tracing from the service console -- no additional instrumentation required.

Trace reporting methods
Cloud services report trace data in one of two ways:
| Method | How it works | Trade-offs | Example |
|---|---|---|---|
| Direct or forwarded trace reporting (recommended) | The service instruments requests internally and reports spans through an Exporter | More detailed spans, richer metadata, standardized format | ARMS User Experience Monitoring (RUM) |
| Log-to-trace conversion | Backend systems convert access logs into trace spans | Lower performance overhead, less intrusive | ALB |
Use log-to-trace conversion when direct instrumentation is unavailable or performance constraints are strict -- as long as the logs include a TraceId for context correlation.
Supported cloud services and tracing protocols
| Category | Service | Tracing protocol | Setup guide |
|---|---|---|---|
| User terminal | Web, HTML5, and mini programs | W3C, B3, Jaeger, SkyWalking | Enable end-to-end tracing for a web application or mini program |
| User terminal | Android and iOS apps | W3C, SkyWalking | Enable end-to-end tracing for an app |
| Gateway | MSE | W3C, B3, SkyWalking | Enable tracing analysis for a cloud-native gateway |
| Gateway | NGINX Ingress Controller | W3C, B3, Jaeger | Enable tracing for the NGINX Ingress controller |
| Gateway | ALB | B3 | Enable Managed Service for OpenTelemetry for ALB |
| Gateway | Service Mesh (ASM) | B3 | Enable distributed tracing in ASM |
| Gateway | API Gateway | B3 | Configure tracing analysis |
| Backend | Java, Go, and Python (ARMS agent) | W3C, B3, Jaeger, SkyWalking, EagleEye | Application Monitoring overview |
| Backend | Other languages (.NET, Node.js, and more) | W3C, B3, Jaeger, SkyWalking | Integration guide |
| Dependent services | 100+ component types | -- | Covers RPC, message queues, databases, and task scheduling |
Propagate trace context
Instrumenting individual services is only the first step. For a complete end-to-end trace, every service in the request path must propagate the same trace context using a shared protocol.
Managed Service for OpenTelemetry uses the W3C Trace Context protocol for end-to-end trace connectivity and will progressively expand coverage to more protocols and services.
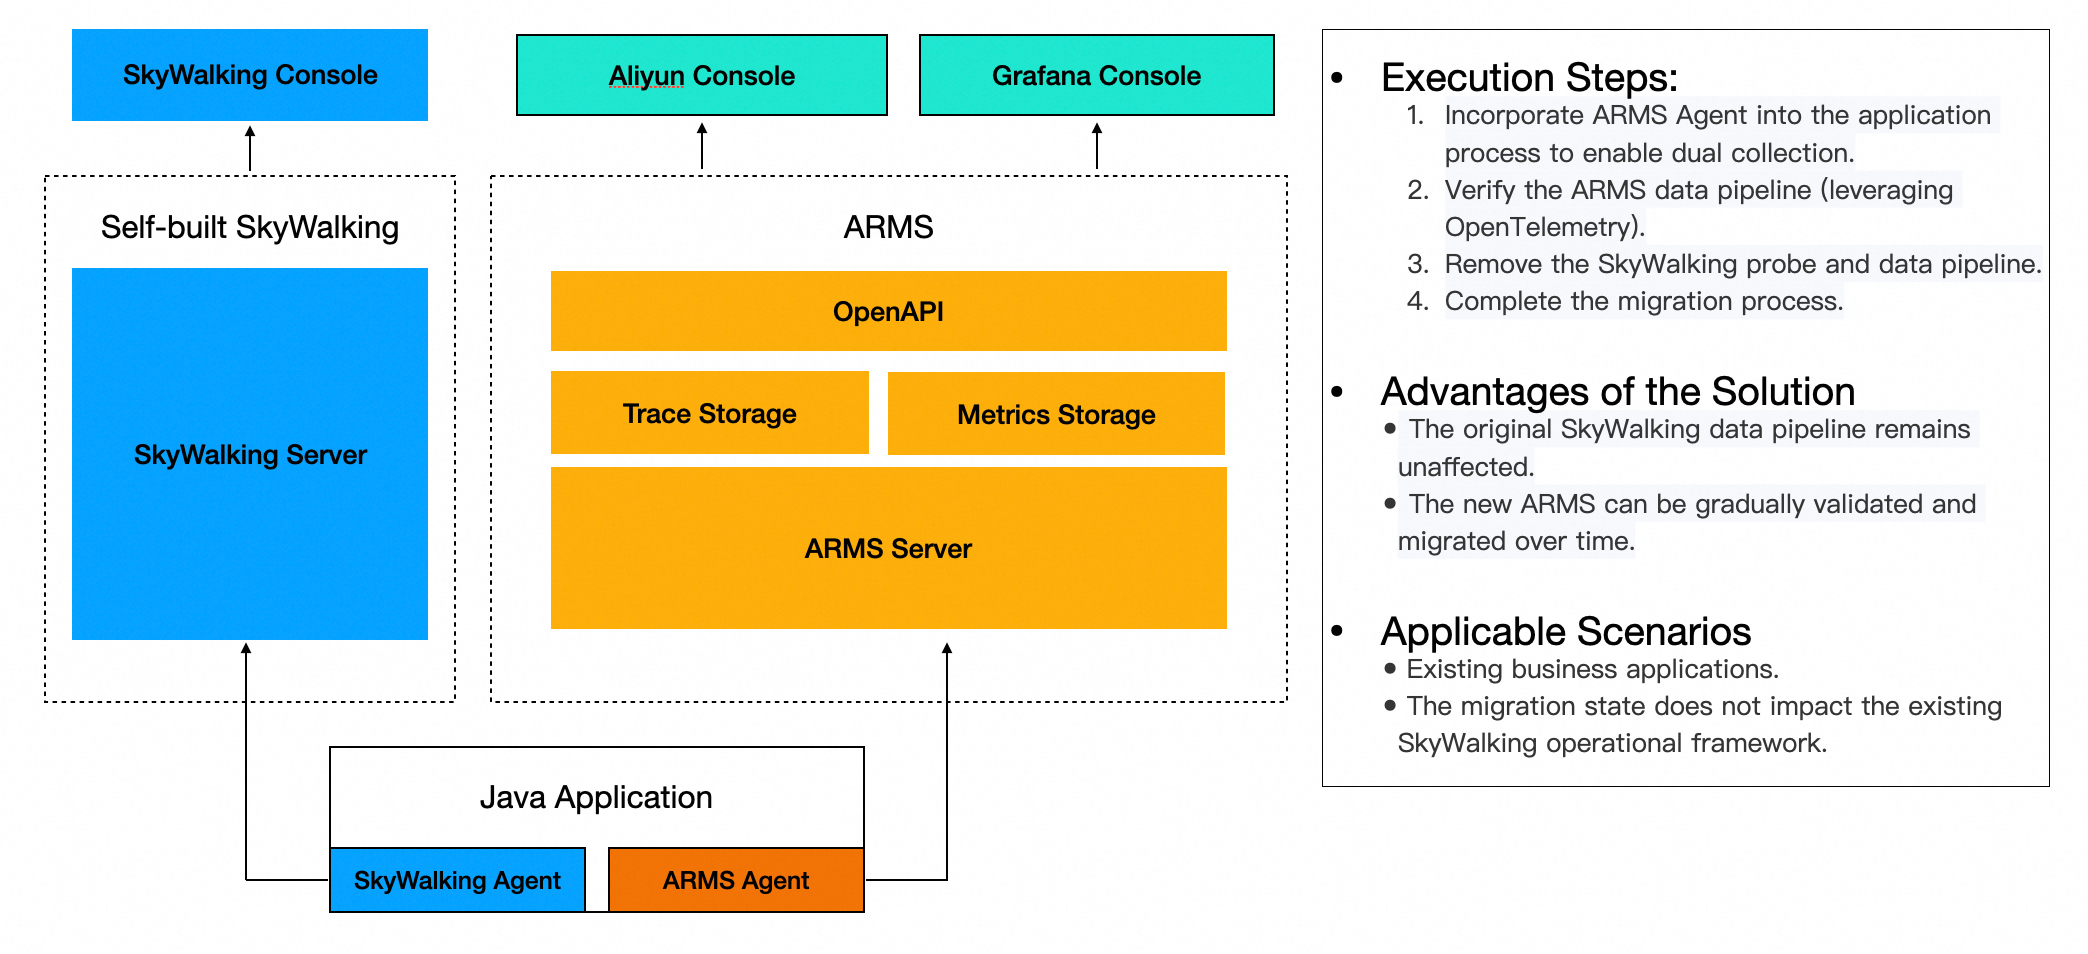
Migrate between tracing systems
Switching tracing systems (for example, from SkyWalking to OpenTelemetry) is one of the hardest challenges in distributed tracing. You must keep the existing system running while validating the new one, often with two agents running side by side.
The ARMS agent supports dual-agent coexistence. Both the legacy and new tracing systems operate correctly and stably until migration is complete.
Convert between tracing protocols
When upstream and downstream services use different propagation protocols and neither can change easily, the ARMS agent acts as a protocol mediator. For example, the upstream application A uses the Jaeger protocol, the ARMS agent receives the Jaeger data and forwards it while converting it to both Jaeger and Zipkin B3 formats, and the downstream application B uses the Zipkin B3 protocol. This ensures seamless trace data transmission between systems using different protocols, and trace continuity and connectivity.