When interface monitoring, pool monitoring, or slow call and error data is missing from the Application Real-Time Monitoring Service (ARMS) console, use this guide to identify and resolve the root cause.
How ARMS monitoring data flows
ARMS monitoring data passes through the following pipeline. A break at any stage causes missing data in the console:
Your application --> ARMS agent (probe) --> ARMS backend --> Console dashboardCommon causes of missing data:
The ARMS agent is not running or cannot connect to the backend.
The monitored framework or component is not supported.
The agent version is too old for the feature.
The application has no matching traffic.
To narrow down the problem, check whether JVM monitoring data appears on the Application Details page. The result determines which section to follow:
| Symptom | Go to |
|---|---|
| No data on any tab, including JVM monitoring | All monitoring data missing |
| JVM data appears but interface data does not | Interface monitoring data missing |
| Pool monitoring tab shows no data | Pool monitoring data missing |
| No slow call or error records | Slow call and error data missing |
All monitoring data missing
No JVM monitoring data means the ARMS agent is disconnected or disabled. Work through these checks in order.
Step 1: Verify that data collection is enabled
Log on to the ARMS console.
In the left-side navigation pane, choose Application Monitoring > Application List.
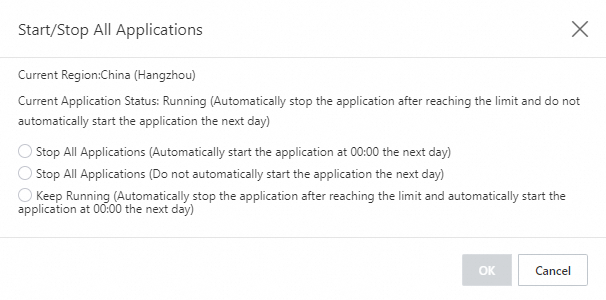
In the upper-right corner, choose Settings > Application Start/Stop Settings.
Confirm that data collection is not disabled for the application.
Step 2: Verify that the probe master switch is on
On the Application List page, click the target application.
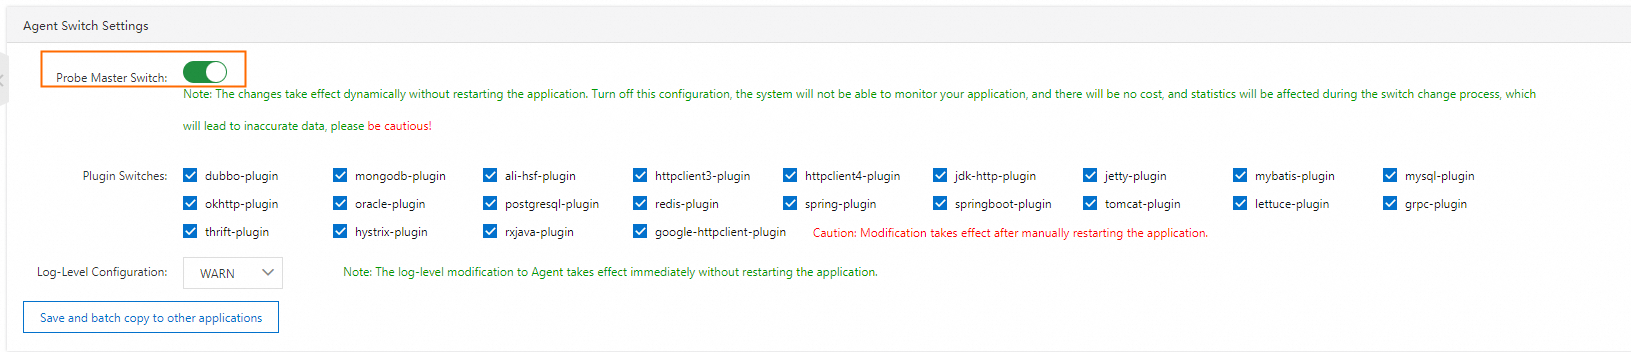
On the Application Settings page, click the Custom Configuration tab.
Confirm that Probe Master Switch is turned on.
Step 3: Check network connectivity
If both settings above are correct, the agent may be unable to reach the ARMS backend.
Log on to the instance where the application runs.
Test network connectivity to the ARMS backend. For details, see How do I test the network connectivity?
If the network is stable, review the application integration process to verify that the agent was attached correctly.
Step 4: Check the JDK version and framework
ARMS has limited support for certain JDK versions and application frameworks. Submit a ticket if either of the following applies:
The application runs on JDK 7 or JDK 17.
The application was not built with Spring Boot.
Step 5: Collect agent logs (agent version earlier than 2.7.3.5)
If the ARMS agent version is earlier than 2.7.3.5, collect the agent logs before you contact support. The logs are stored in the following directory:
/home/admin/.opt/ArmsAgent/logsInclude these logs when you submit a ticket.
Interface monitoring data missing
If JVM monitoring data appears but interface monitoring data does not, the agent is connected to the ARMS backend. The issue is related to traffic or framework compatibility.
Check inbound traffic
Interface monitoring captures data only when the application receives requests. Verify that the application has inbound traffic during the time range selected in the console.
Check framework compatibility
ARMS monitors a specific set of Java components and frameworks. If your application uses an unsupported framework, interface calls are not captured.
Review the list of Java components and frameworks supported by ARMS.
If your framework is not listed, submit a ticket to request support.
Pool monitoring data missing
ARMS provides pool monitoring for the following components:
| Component | Type |
|---|---|
| Custom thread pools | Thread pool |
| Dubbo | RPC framework |
| Apache Tomcat | Web server |
| OkHttp | HTTP client |
| Apache HttpClient | HTTP client |
| Druid | Connection pool |
| HikariCP | Connection pool |
Pool monitoring requires ARMS agent version 2.8.3 or later. If your agent version is earlier than 2.8.3, upgrade the agent.
To check and upgrade the agent, see Release notes of the ARMS agent for Java.
Slow call and error data missing
ARMS captures slow calls and errors only when the application traffic meets specific conditions.
Slow calls
ARMS records a call as slow when its response time exceeds 500 milliseconds. If no calls exceed this threshold, no slow call data appears.
Errors
ARMS captures two types of errors:
HTTP responses with a status code greater than 400
Interface call exceptions that propagate to the outermost layer
If neither condition occurs in your application traffic, no error data is recorded.