Database administrators and developers focus on performance optimization and monitoring. Database Autonomy Service (DAS) provides the new performance insight feature. The feature collects information about SQL statements by using the Performance Schema feature of MySQL to identify performance issues at the earliest opportunity and provide solutions to improve the performance and stability of the database system. The feature also collects statistics on tables and indexes on which no operations are performed to help you analyze the collected data and identify the data that can be deleted. This increases the storage usage and database performance.
Prerequisites
The RDS instance runs MySQL.
NoteThe RDS instance does not run RDS Basic Edition.
The RDS instance does not run MySQL 5.5.
The memory capacity of your RDS instance is greater than or equal to 8 GB.
The Performance Schema feature is enabled for the RDS instance. For more information, see Enable the Performance Schema feature.
NoteIf you enable the Performance Schema feature for the RDS instance, a specific amount of resources of the RDS instance are consumed. For more information, see Stress testing report of Performance Schema.
The RDS instance resides in one of the following regions: China (Hangzhou), China (Shanghai), China (Qingdao), China (Beijing), China (Zhangjiakou), China (Shenzhen), China (Chengdu), China (Hong Kong), Singapore, Malaysia (Kuala Lumpur), and Indonesia (Jakarta).
Billing rules
The new performance insight feature is a value-added feature of DAS Economy Edition and DAS Enterprise Edition V3. If you enable the feature for an RDS instance in a region that supports DAS Economy Edition and DAS Enterprise Edition V3, the fee for the feature varies based on the DAS edition that you use.
For more information about the regions supported by DAS Economy Edition and DAS Enterprise Edition V3, see Supported databases and regions.
For more information about the billing details of DAS Economy Edition and DAS Enterprise Edition V3, see Billing details.
In regions that do not support DAS Economy Edition and DAS Enterprise Edition V3, the public preview of the new performance insight feature continues. When DAS Economy Edition and DAS Enterprise Edition V3 are supported in these regions, the public preview of the new performance insight feature ends. After the public preview ends, the new performance insight feature becomes a value-added feature provided by DAS Economy Edition and DAS Enterprise Edition V3.
Feature description
The new performance insight feature aggregates statistics on SQL statements based on the Performance Schema feature provided by MySQL to help you evaluate instance loads and identify the root causes of performance issues. The new version provides the following capabilities:
Identifies the Resource Usage, Executions, Scanned Rows, and Execution Duration of all SQL statements.
Allows you to view the trends of performance metrics and the details of specified SQL statements.
Allows you to query the details of specified SQL statements by using SQL IDs and keywords.
Allows you to view information about the trends of the Resource Usage, Executions, Scanned Rows, and Execution Duration of the specified SQL statements, and the information about SQL samples related to the SQL statements.
Throttles and optimizes the specified SQL statements.
Allows you to compare and view the Resource Usage, Executions, Scanned Rows, and Execution Duration of all SQL statements within different periods of time, and the performance metrics of the specified SQL statements within different periods of time.
Allows you to view the statistics on the tables and indexes on which no operations are performed. DAS collects the statistics on the tables and indexes every early morning, determines whether operations are being performed on the tables and indexes, and records the number of accumulated days during which no operations are performed on the tables and indexes of your RDS instance.
NoteThe minimum number of accumulated days during which no operations are performed on the tables and indexes is set to seven days. After the no flow meter/index identification feature is enabled, you can view the data of the tables and indexes on which no operations are performed at least seven days later.
The new performance insight feature provides more metrics than the original performance insight feature and more methods to view performance metrics. The following table compares the two versions.
Item | New performance insight | |
Metrics |
|
|
View methods |
| Allows you to view the metric trends and the details of specified SQL statements within a specified period of time. |
Solutions | Throttles and optimizes the specified SQL statements. | Optimizes specified SQL statements. |
Procedure
Go to the Instances page. In the top navigation bar, select the region in which the RDS instance resides. Then, find the RDS instance and click the ID of the instance.
In the left-side navigation pane of the page that appears, choose .
On the page that appears, click Enable Performance Insight.Performance Insight
If the Performance Schema feature is disabled, the Parameter Settings dialog box appears. You need to click Configure to configure parameters related to the Performance Schema feature. For more information, see Enable the Performance Schema feature.
WarningYou must restart the RDS instance for the parameter configuration to take effect. We recommend that you perform this operation during off-peak hours and make sure that your application is configured to automatically reconnect to the RDS instance.
When you enable the new performance insight feature, the system automatically enables the no flow meter/index identification feature. This feature identifies tables and indexes on which no operations are performed.
ImportantStarting April 11, 2023, the no flow meter/index identification feature is supported. When you enable the new performance insight feature for an RDS instance, the no flow meter/index identification feature is automatically enabled for the RDS instance. If the new performance insight feature is enabled for an RDS instance before April 11, 2023, you can manually turn on Identification for Tables and Indexes with No Traffic in the Service Settings dialog box.
Click one of the following tabs based on your business requirements.Performance Insight
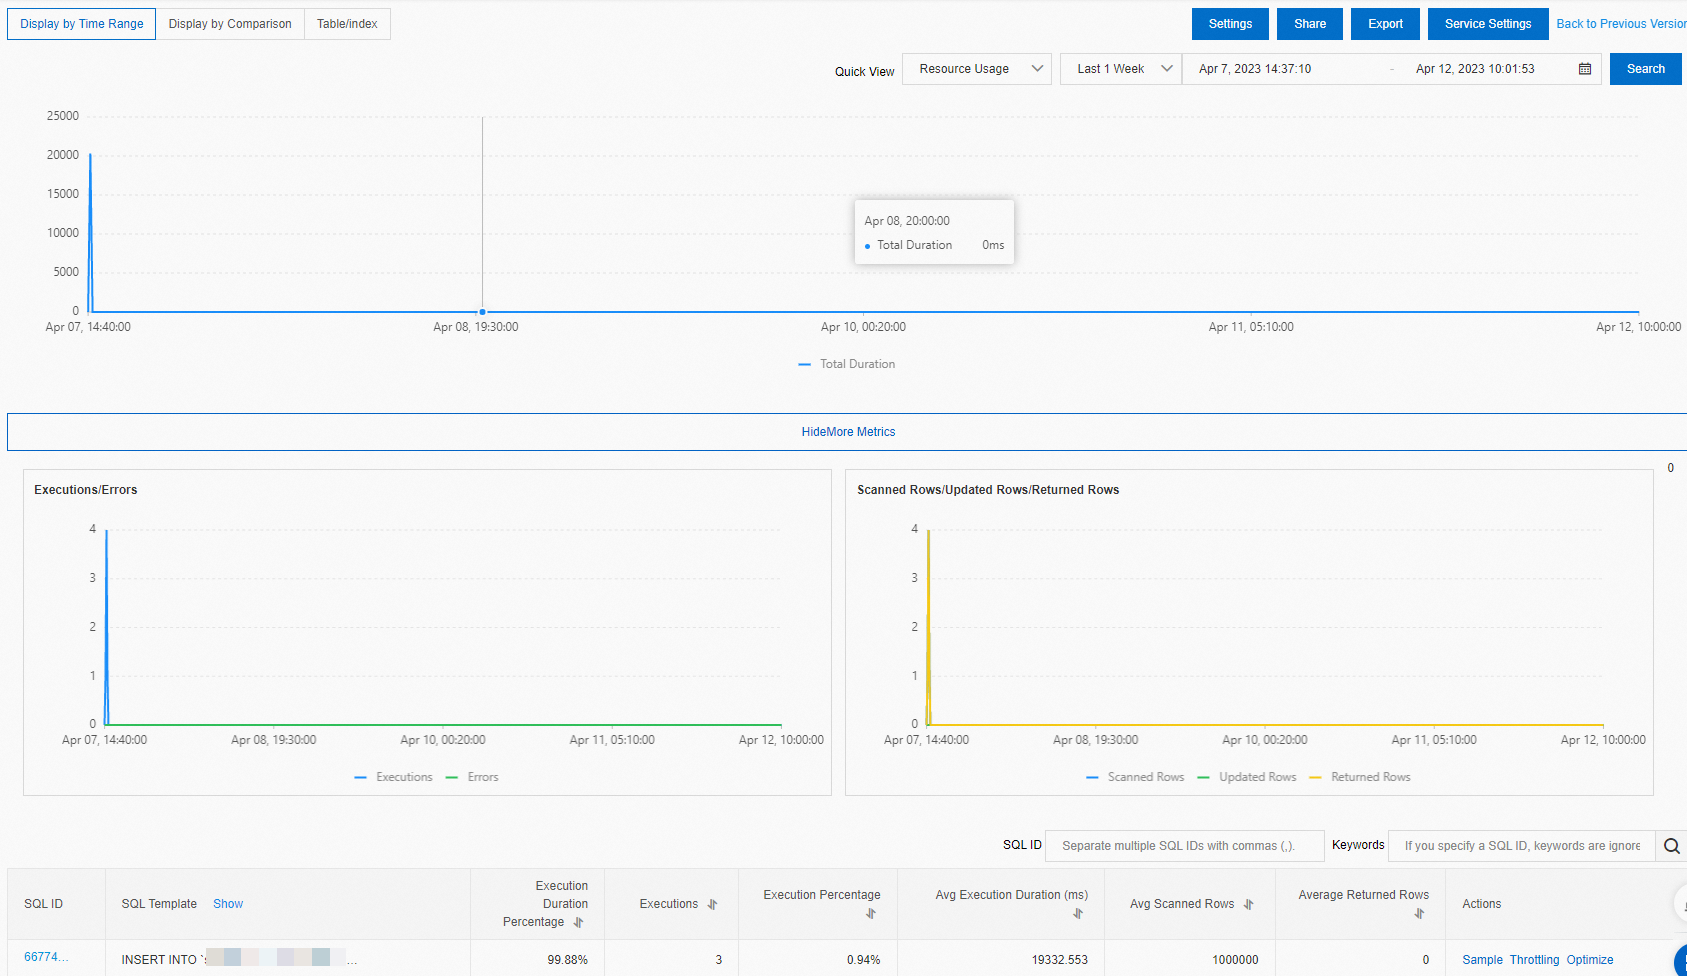
Display by Time Range:
Select a time range to view the Resource Usage, Executions, Scanned Rows, and Execution Duration trend charts of all SQL statements within the specified time range.
NoteWhen you select a time range, the end time must be later than the start time. You can query data within up to seven days of the last month.
Click Export to save the data as a file to your computer.
Click Show More Metrics to view the trend charts of key performance metrics.
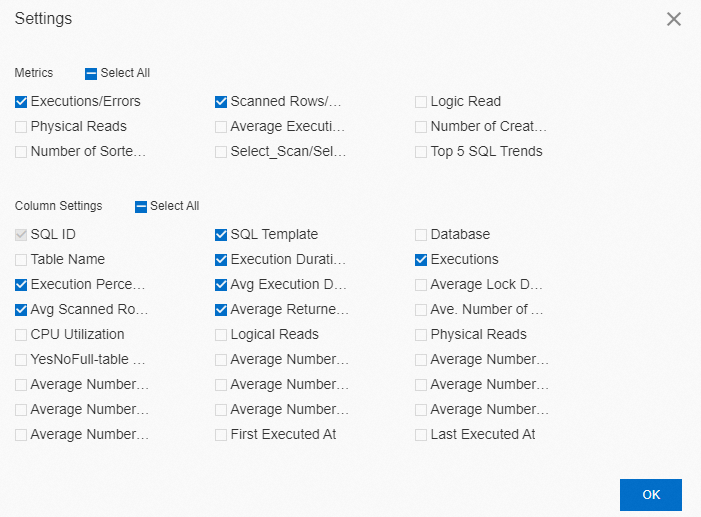
NoteYou can click Settings and select the metrics that you want to view in the Metrics section.
In the SQL list section, perform the following operations to view the details of SQL statements.
NoteYou can click Settings and select the performance metrics that need to be displayed in the list in the Column Settings section.
Click the ID of the SQL statement that you want to manage to view the Resource Usage, Executions, Scanned Rows, and Execution Duration trend charts of the SQL statement within a specified time range. You can also view the details of the SQL sample related to the SQL statement.
Click Sample in the Actions column of the SQL statement that you want to manage to view the details of the SQL sample related to the SQL statement.
Click Throttling in the Actions column of the SQL statement that you want to manage. In the SQL Throttling dialog box, configure throttling parameters to throttle the SQL statement. For more information, see SQL throttling.
Click Optimize in the Actions column of the SQL statement that you want to manage. In the SQL Diagnostic Optimization dialog box, view the diagnostic results.
If you accept the SQL optimization suggestions, click Copy in the upper-right corner of the page and paste the optimized SQL statement to the database client or Data Management (DMS) for execution. If you do not accept the SQL optimization suggestions, click Cancel.
NoteDAS performs SQL diagnostics based on the complexity of SQL statements, the amount of data in the table, and the instance workloads. Suggestions may be returned in more than 20 seconds after the SQL diagnostics is performed. After the diagnostics is complete, the SQL diagnostics engine provides diagnostics results, optimization suggestions, and expected optimization benefits. You can determine whether to accept the suggestions based on the diagnostics results.
You can also click (Database Expert Service) to purchase the expert service. Database Expert Service provides value-added professional database services, such as emergency solutions, health diagnostics, performance optimization, security assurance, and data migration.
Display by Comparison: Select a point in time at which you want to compare the performance insight results to view the comparison results of the Resource Usage, Executions, Scanned Rows, and Execution Duration of all SQL statements at the specified point in time. You can also view the comparison details in the SQL list section.
NoteYou can click Settings to select the performance metrics to be displayed in the list.
Tables/Indexes: You can set filter conditions to query data that meet the requirements of Tables with No Traffic and Indexes with No Traffic.
Click Export to save the data as a file to your computer.
Disable the new performance insight feature
Go to the Instances page. In the top navigation bar, select the region in which the RDS instance resides. Then, find the RDS instance and click the ID of the instance.
In the left-side navigation pane of the page that appears, choose .
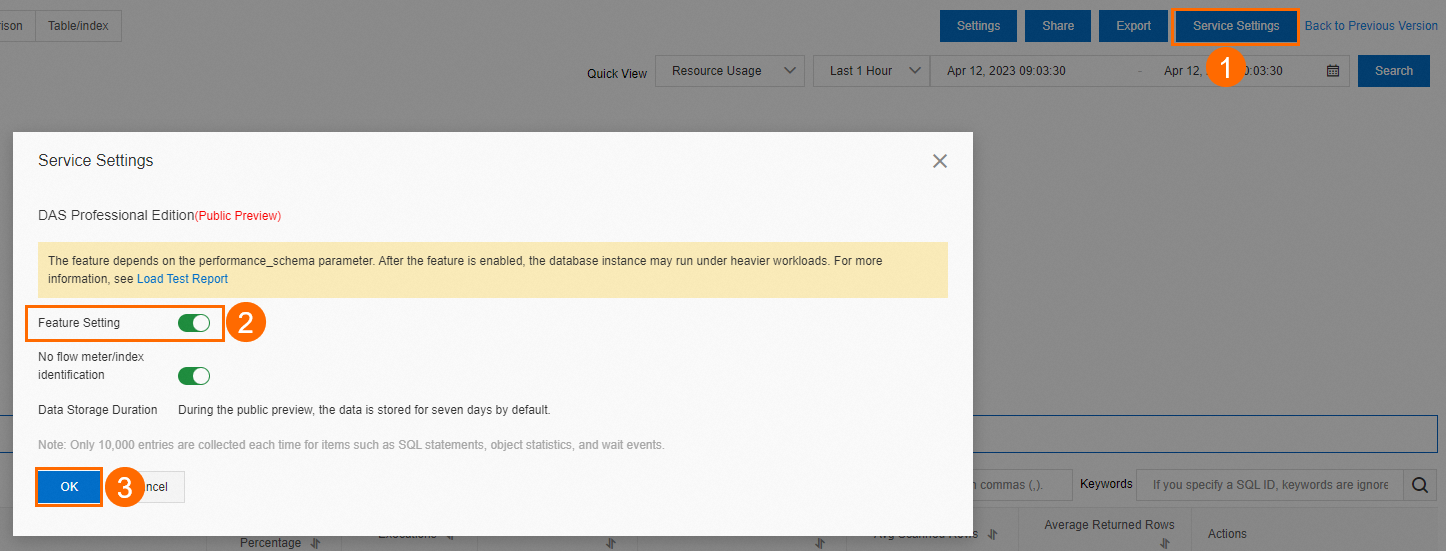
On the page that appears, click Service Settings. In the dialog box that appears, turn off Feature Setting and click OK. In the message that appears, click OK to disable the new performance insight feature.Performance Insight Performance Insight
After the new performance insight feature is disabled, the system automatically disables the no flow meter/index identification feature. You can also separately disable the no flow meter/index identification feature. After the feature is disabled, DAS deletes all collected statistics on the tables and indexes on which no operations are performed and the data that is used by the tables and indexes.Identification for tables and indexes with no traffic is disabled.
ImportantAfter the new performance insight feature is disabled, DAS no longer collects data and DAS deletes historical data.
References
You can enable the autonomy features of DAS to implement automatic governance to resolve performance issues.