Performance Insight helps you evaluate instance load and troubleshoot performance issues on ApsaraDB RDS for MySQL. It aggregates SQL statement statistics based on MySQL's Performance Schema, giving you instance-level load monitoring, association analysis, and performance optimization in one place.
Database Autonomy Service (DAS) provides a newer version of Performance Insight that adds the ability to view resource usage, number of executions, number of scanned rows, and execution duration for all SQL statements, and lets you throttle and optimize specific SQL statements. For details, see Use the new performance insight feature for an ApsaraDB RDS for MySQL instance.
Prerequisites
Before you begin, ensure that your RDS instance runs one of the following MySQL versions and editions:
MySQL 8.0 on RDS High-availability Edition, RDS Enterprise Edition, or RDS Cluster Edition
MySQL 5.7 on RDS High-availability Edition, RDS Enterprise Edition, or RDS Cluster Edition
MySQL 5.6 on RDS High-availability Edition
MySQL 5.5 on RDS High-availability Edition
How it works
Performance Insight collects data from two possible sources, depending on whether Performance Schema is enabled on your instance:
| Performance Schema | Data source |
|---|---|
| Enabled | Performance Schema data |
| Disabled | Active session data |
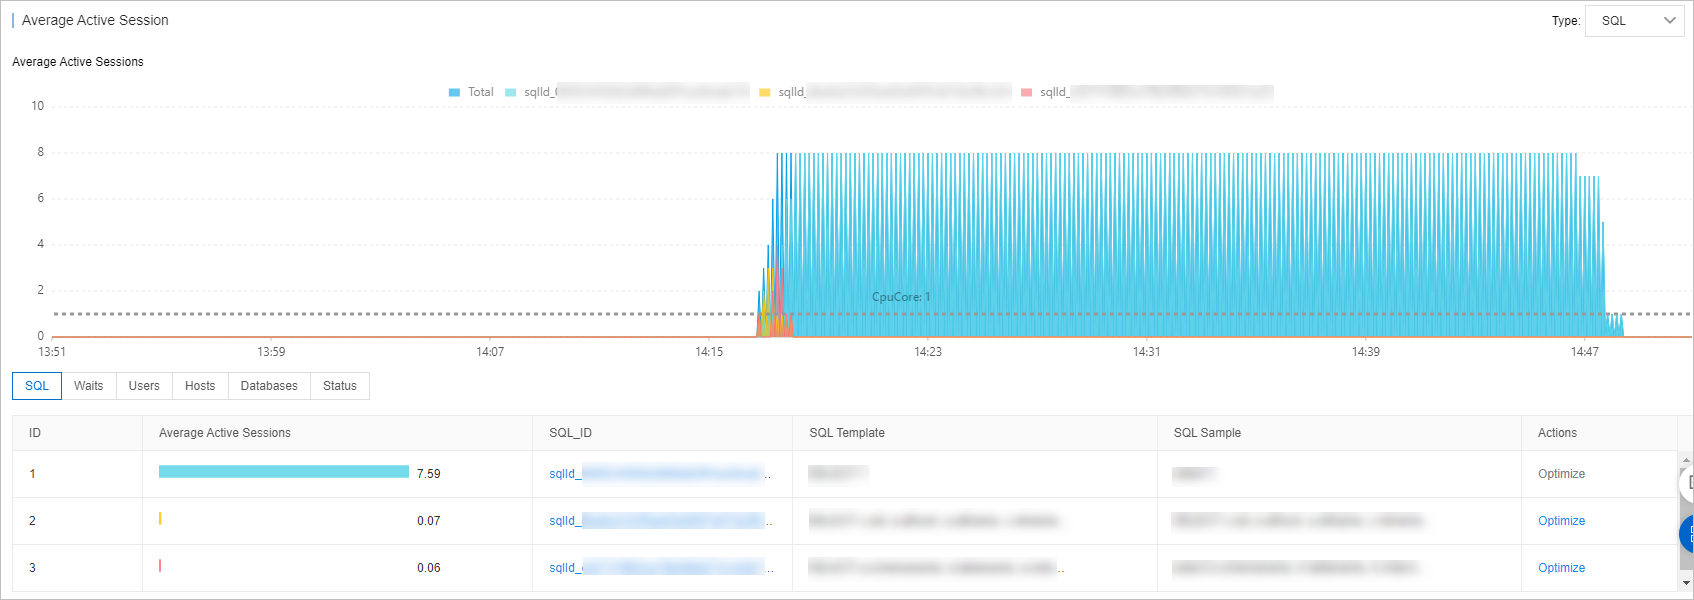
Average Active Session
In the Average Active Session section, you can view the trends of different types of sessions, such as sessions that are created to execute SQL statements. You can also view instance loads from multiple dimensions to help identify the root causes of performance issues.
Data retention:
| Section | Retention |
|---|---|
| Performance Insight | Up to 7 days within the last month |
| Average Active Session | Last 3 days |
Enable Performance Insight
Go to the Instances page. In the top navigation bar, select the region where your RDS instance resides. Find the instance and click its ID.
In the left-side navigation pane, choose Autonomy Service > Performance Insight.
If the new version of Performance Insight is active, click Back to Previous Version to switch to the original version. If Back to Previous Version is not displayed, you are already on the original version.

Click Enable Performance Insight. In the confirmation dialog, click OK.
To disable the feature later, click Disable Performance Insight on the Performance Insight page.
View performance metrics
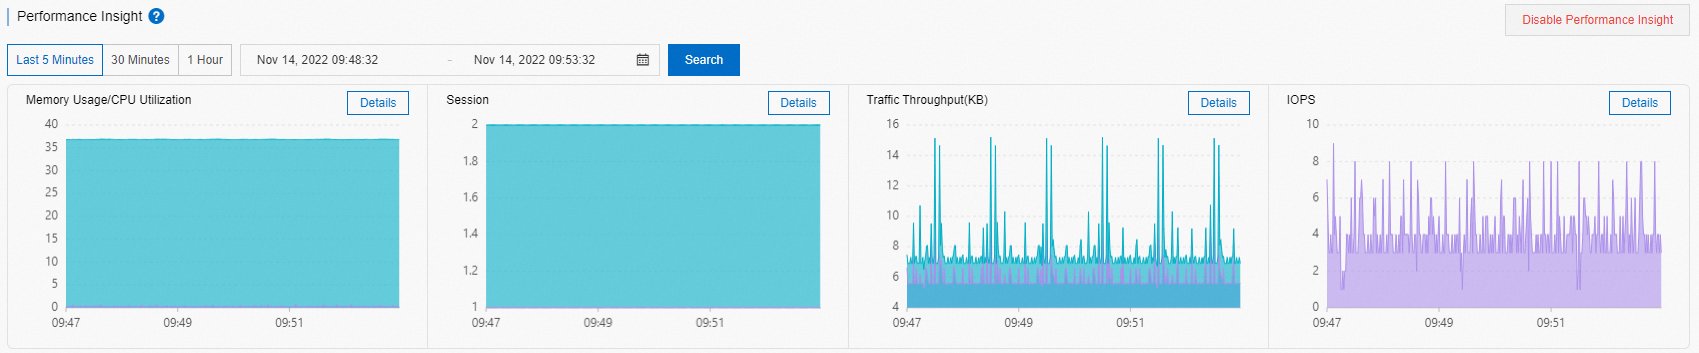
In the Performance Insight section, set a time range and click Search.
The end time must be later than the start time.
To drill into a specific metric, click Details to the right of the metric name. For example, click Details next to Memory Usage/CPU Utilization to see the CPU utilization trend.
In the Average Active Session section, review session trends by type, including sessions executing SQL statements. Use the multi-dimensional view to identify the root cause of performance issues.
What's next
Enable DAS autonomy features to automatically resolve performance issues: