If your ApsaraDB RDS for MySQL instance fails, you can use the diagnostics feature to diagnose the performance of the RDS instance within a specified time range. This feature visualizes the diagnostic results in a comprehensive manner and helps you locate the causes of the instance failure.
Prerequisites
Your RDS instance runs one of the following MySQL versions and RDS editions:
MySQL 8.0 on RDS High-availability Edition, RDS Enterprise Edition, or RDS Cluster Edition
MySQL 5.7 on RDS High-availability Edition, RDS Enterprise Edition, or RDS Cluster Edition
MySQL 5.6 on RDS High-availability Edition
MySQL 5.5 on RDS High-availability Edition
Procedure
Go to the Instances page. In the top navigation bar, select the region in which the RDS instance resides. Then, find the RDS instance and click the ID of the instance.
In the left-side navigation pane, choose Autonomy Services > Diagnostics.
Click the Diagnostics tab.
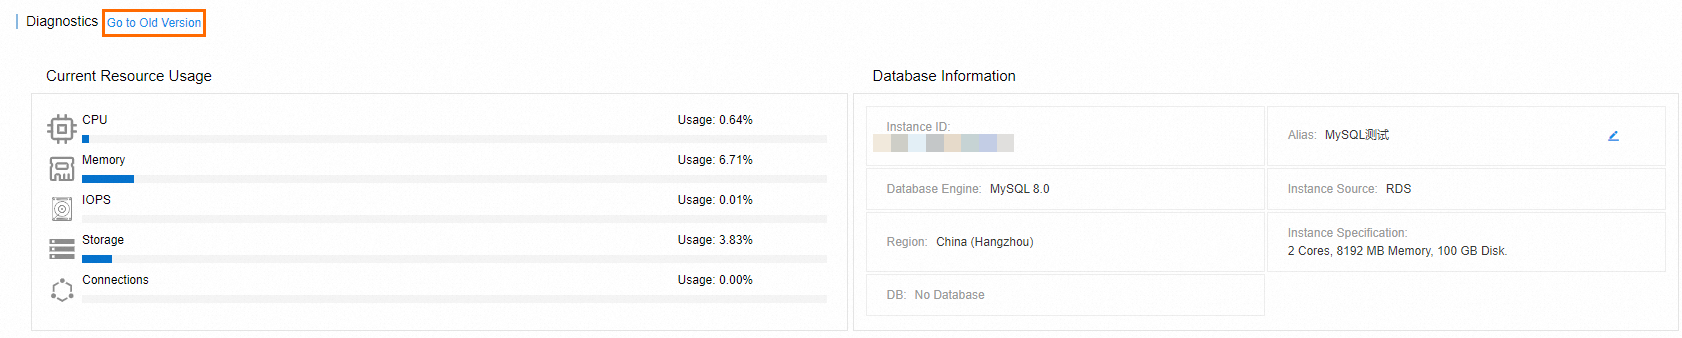
In the Diagnostics section, select a time range to perform diagnostics and view the diagnostic results.
You can click View History to view historical diagnostic results.
You can click Go to Old Version or Go to New Version to switch between old and new versions.
References
After you learn the performance of the RDS instance by using the diagnostics feature, you can use the following features to diagnose the RDS instance in a comprehensive manner, locate the failure causes, and handle the failure.
FAQ
How do I calculate the thread usage, connection usage, and maximum number of threads of a session on an RDS instance?
You can calculate these metrics by using the following formulas:
Thread usage = Number of active threads/Maximum number of threads
Connection usage = Number of current connections/Maximum number of connections allowed by the instance type
Maximum number of threads = Value of thread_pool_size × (Value of thread_pool_oversubscribe + 1)
Why does the thread usage exceed 100%?
If the number of active threads is greater than the maximum number of threads, the thread usage exceeds 100%. The method that is used to implement thread pooling for ApsaraDB RDS for MySQL does not impose limits on the number of active threads. Therefore, the number of active threads may be greater than the maximum number of threads.