Exception handling
The exception handling feature displays the abnormal events that have occurred or are occurring in the database cluster in the last 3 days. You can use this feature to quickly obtain the health status of the cluster and, when abnormal events occur, perform root cause analysis to pinpoint the cause of the problem.
View the list of abnormal events for all instances
Log on to the ApsaraDB for OceanBase console.
In the left-side navigation pane, choose Autonomy Service > Exception Handling.
In the Abnormal Events section, view the list of abnormal events for all instances.
By default, the system displays all abnormal events in the last 3 days, including those that are still ongoing and those that have been restored. Currently, the following types of abnormal events are supported: node CPU exception, tenant CPU exception, tenant SQL queue waiting time exception, SQL mass error reporting exception, data disk I/O usage exception, tenant active session number exception, tenant disk I/O time exception, node clog disk I/O high usage, node data disk I/O high time, node data disk capacity high usage.
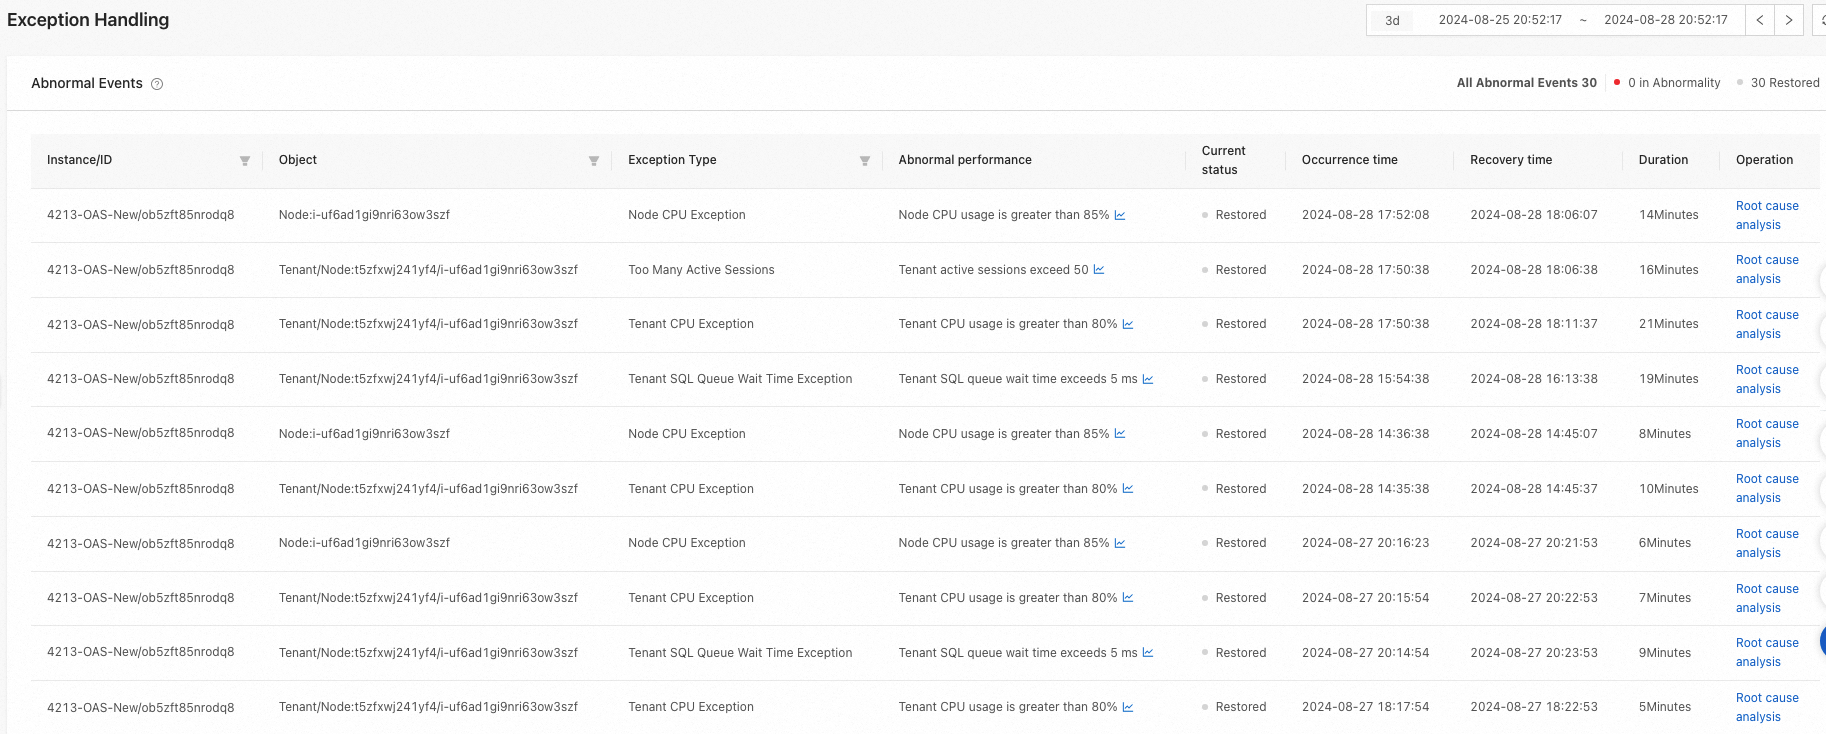
View abnormal events for a single instance
In the Abnormal Events section, view the Root Cause Analysis in the Operation column of the target instance.
The system automatically redirects to the Exception Handling page of the diagnostics center.
In the Abnormal Events section, view abnormal events of the target instance, including Object, Exception Type, Abnormal Performance, Current Status, Occurrence Time, Recovery Time, Duration, and Operation.
Click the Root Cause Analysis in the Operation column of a single abnormal event to view the root cause analysis and optimization suggestions for the abnormal event.
NoteYou can click View Smart Interpretation to view the diagnostic results and suggestions provided by AI. The content of the AI smart interpretation is for informational purposes only.
If the cause of the abnormal event is in the analysis graph, the system will highlight the cause in red and provide optimization suggestions.
NoteIn the analysis graph, each node represents an analysis rule. When performing root cause analysis, the system traverses the graph to find the root cause node. The root cause node is highlighted in red, while the green node indicates that the rule does not hit the root cause.
The following is an example:
Upon detecting Tenant Queue Waiting Becomes Longer within the specified time period, the system provides a prompt that the CPU usage is too high. In the Analysis Path section, you can click the red highlighted box to view the corresponding root cause analysis.
In the SQL Summary Information section, the system displays SQL Summary Time Period, Total Executions, Total Number of Error Executions, Maximum Elapsed Time (ms), CPU Time (ms), and Plan Generation Time (ms) by default. You can view more information by clicking Manage Columns.
In the Possible Root Cause SQL section, you can view the SQL that may cause the problem and click View SQL Details in the Actions column.
If the cause of the abnormal event is not in the analysis graph, the system will provide optimization suggestions in the Solution section.
The following is an example:
Upon detecting Tenant CPU Exception, the system will still display the analysis graph and provide optimization suggestions in the Solution section.