View optimization suggestions
The optimization center displays performance monitoring metrics for each tenant, as well as SQL-class and structural-class optimization suggestions. This topic describes how to view these optimization suggestions.
Background information
By default, the optimization center displays the results of the most recently successfully executed detection task. After the detection is initiated, the system will perform optimization detection on the top 100 SQL statements with the slowest response time during the query period, and evaluate whether there is room for optimization in the related tables and indexes.
Procedure
Log on to the ApsaraDB for OceanBase console.
In the left-side navigation pane, choose Autonomy Service > Diagnostics Center.
In the Instance Details section, click the name of the target instance.
The system automatically redirects to the diagnostics center.
In the left-side navigation pane, click Optimization Management.
The system automatically displays the Optimization Suggestions tab.
In the Tenant section, view the QPS, Average SQL Statement Processing Time, and CPU Percent of a tenant.
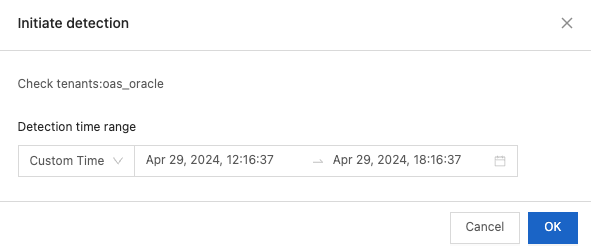
Click Initiate Detection in the upper-right corner to start a detection task. The task detects SQL statements, tables, and indexes that match the rule within the specified time period and provides optimization suggestions.
NoteYou can specify a custom period within the last 15 days as the time range for detection. The time range cannot exceed 24 hours.
Click Detection History in the upper-right corner to view history detection tasks.
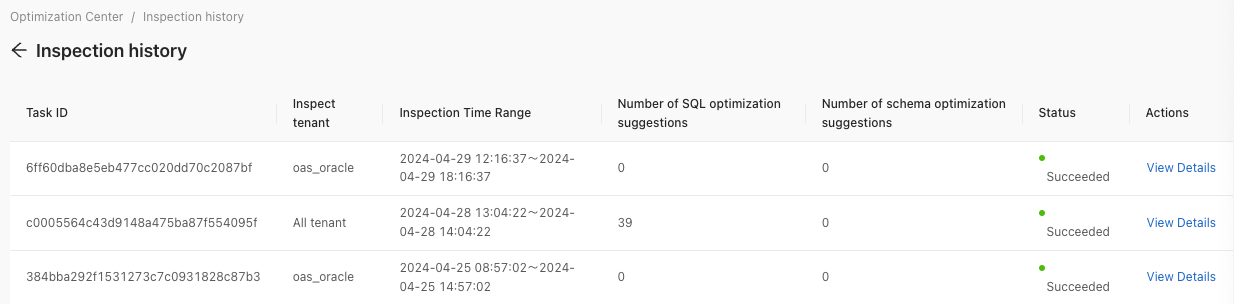
Click View Details in the Operation column of a detection task to view details about this task.
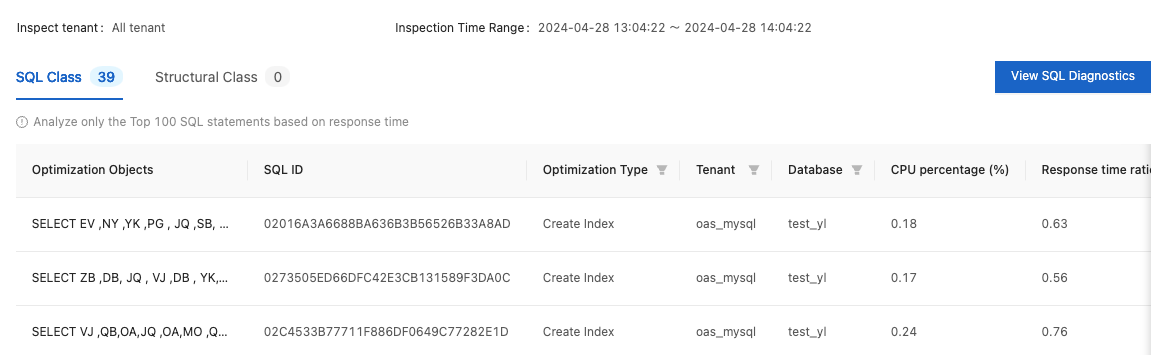
View the optimization suggestions and diagnostics reasons.
Click View SQL Diagnostics and go to the SQL Insights page for details.
On the SQL Class tab, view information in the following columns: Optimization Objects, SQL ID, Optimization Type, Tenant, Database, CPU Percentage, Response Time Ratio, Reasons for Diagnosis, and Optimization Suggestions.
On the Structural Class tab, view information in the following columns: Optimization Objects, Optimization Type, Tenant, Database, Reasons for Diagnosis, and Optimization Suggestions.