When a dedicated host in your ApsaraDB for MyBase cluster shows signs of performance degradation or resource exhaustion, the host details page gives you three views to diagnose the issue: basic host configuration, physical host resource metrics, and per-instance resource usage.
Prerequisites
Before you begin, ensure that you have:
-
A host added to a MyBase dedicated cluster
-
Access to the ApsaraDB for MyBase console
View host details
-
Log on to the ApsaraDB for MyBase console.
-
In the upper-left corner, select a region.
-
In the left-side navigation pane, click Hosts.
-
Find the host and click Details in the Actions column.
-
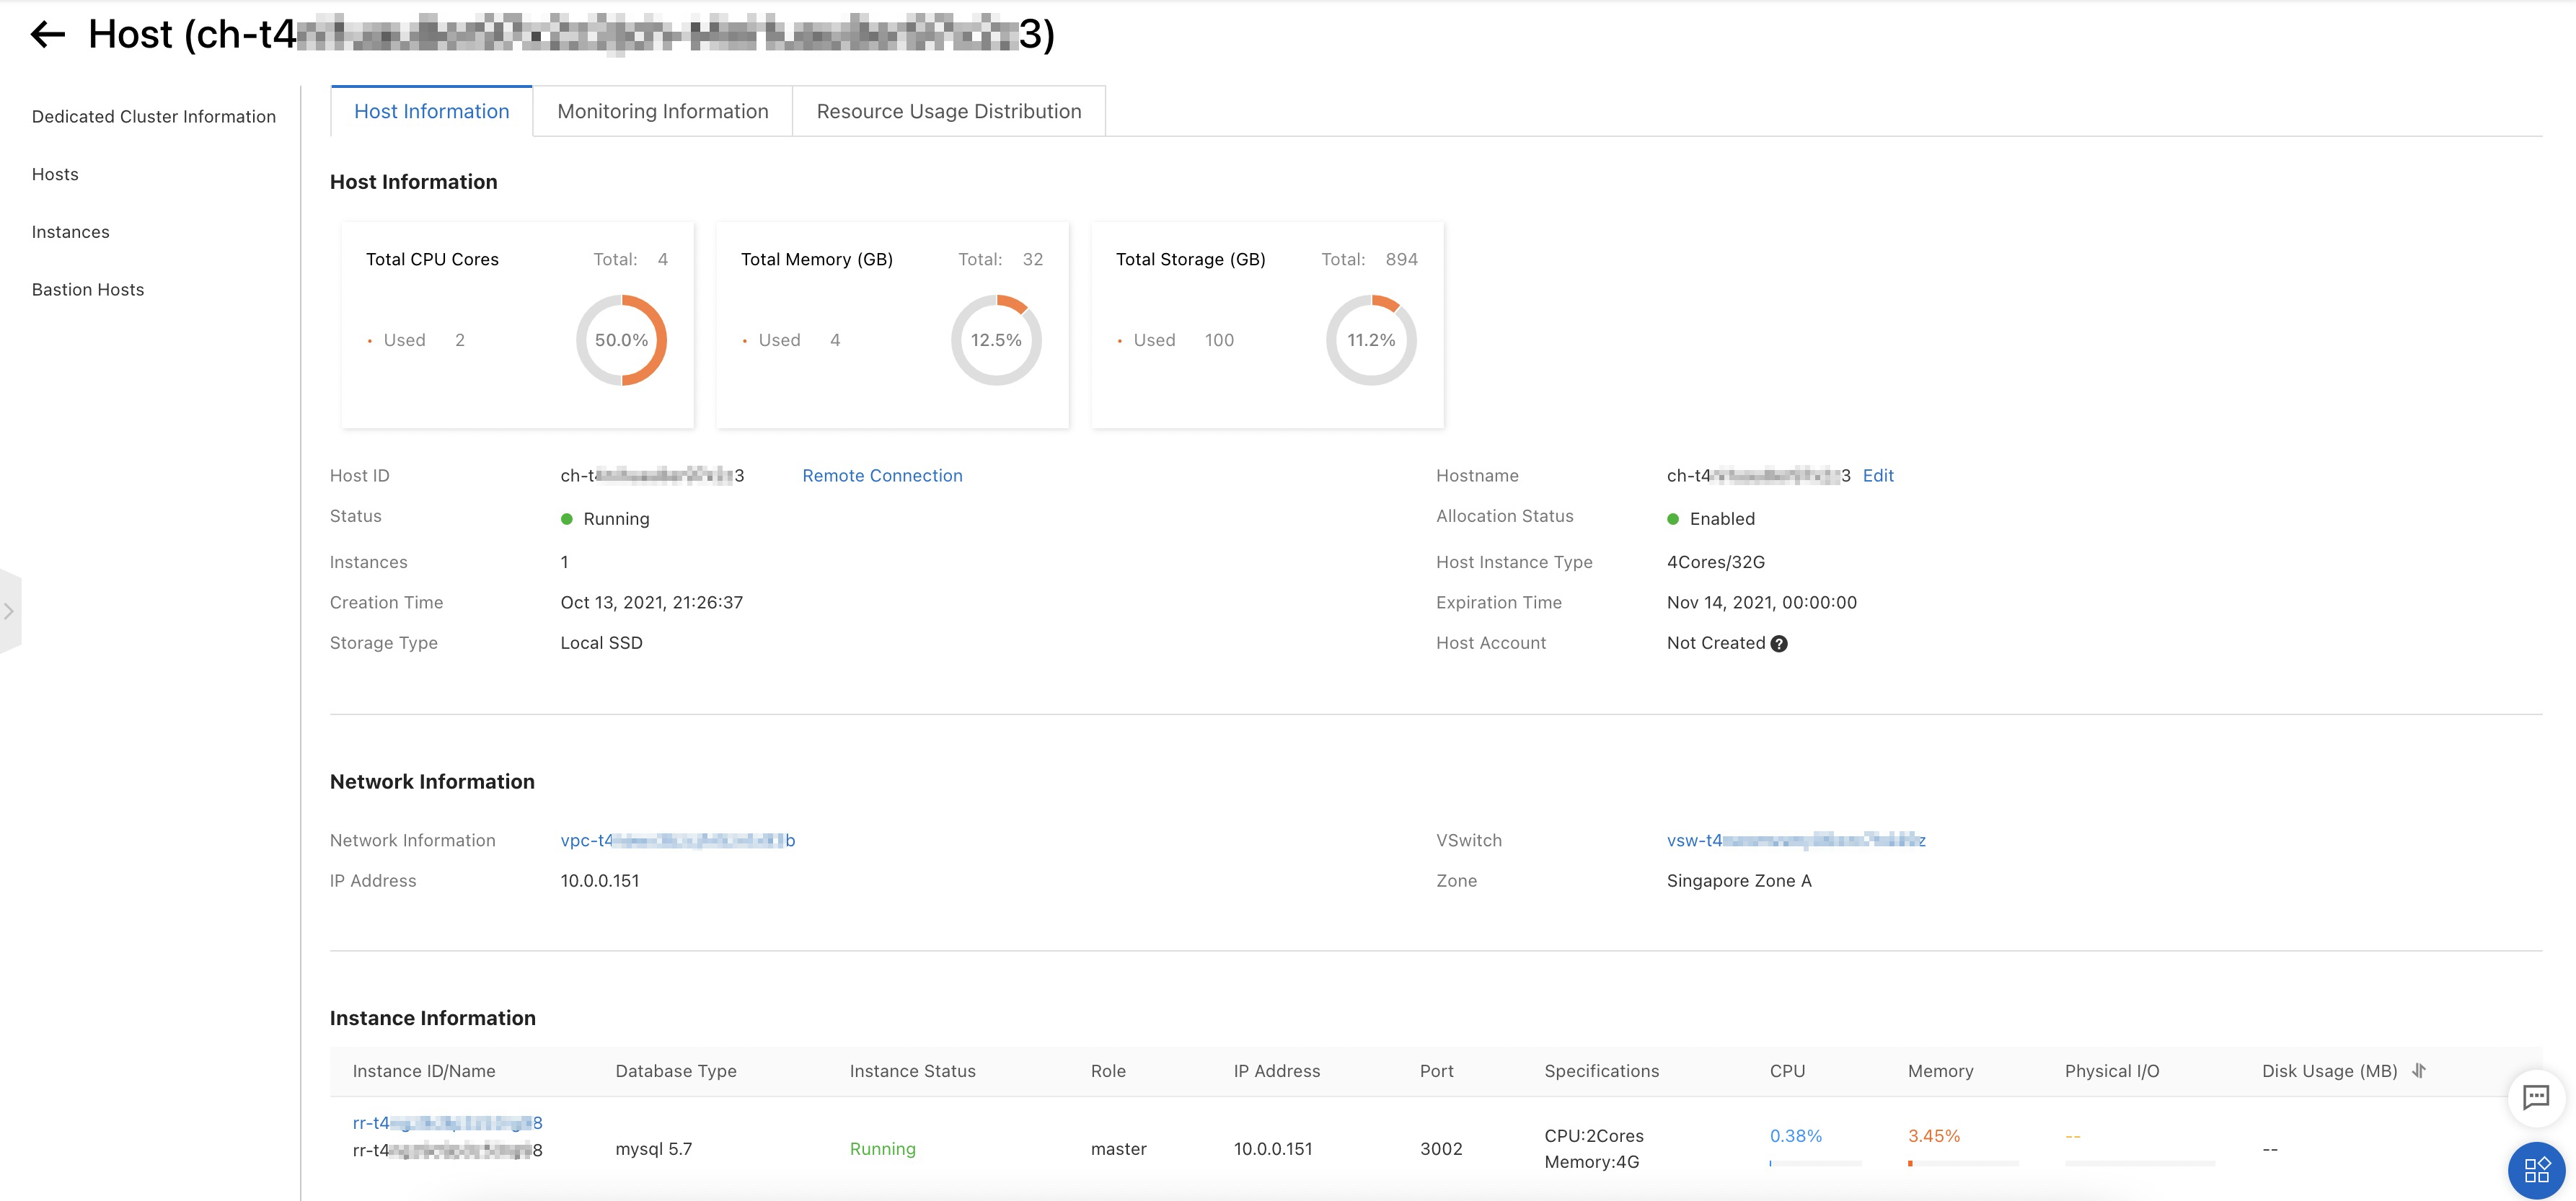
Click the Host Information tab to view the host's basic configuration. The tab displays the host ID, name, instance type, storage type, expiration time, the number of instances on the host, and detailed information about each instance.
 Note
NoteIf you set Grant OS Permissions to Enabled when you created the dedicated cluster, you can log on to the host to manage it directly. For more information, see Connect to a host.
-
Click the Monitoring Information tab to view resource metrics for the physical host. The tab displays CPU utilization, memory usage, and disk usage.
NoteTo set alert rules for these metrics, click Threshold Alerting Settings. For more information, see Alert service.
-
Click the Resource Usage Distribution tab to see how individual instances consume resources on the host. Use this tab when the Monitoring Information tab shows high CPU or memory usage and you need to identify which instance is responsible. The tab breaks down resource consumption by instance, helping you locate the source of performance issues for ApsaraDB for MyBase for MySQL instances.