When a SQL query runs slowly or consumes excessive resources, SQL diagnostics in AnalyticDB for MySQL lets you pinpoint the bottleneck. The feature collects execution statistics at three levels — query, stage, and operator — and surfaces optimization suggestions at each level. This topic explains how to view query properties and navigate diagnostic results from the AnalyticDB for MySQL console.
Supported regions
SQL diagnostics is not available for clusters in the following regions:
-
Germany (Frankfurt)
-
UK (London)
-
US (Silicon Valley)
-
US (Virginia)
Usage notes
The SQL diagnostics feature is not supported for clusters that are created in the Germany (Frankfurt), UK (London), US (Silicon Valley), and US (Virginia) regions.
View query properties
-
Go to the SQL Diagnostics tab. For details, see Go to the SQL Diagnostics tab.
-
In the upper-right corner of the SQL Diagnostics tab, set the search conditions. For example, select Last 5 Minutes and Top 100 Most Time-consuming Queries.
-
Open the query details page using one of the following methods:
-
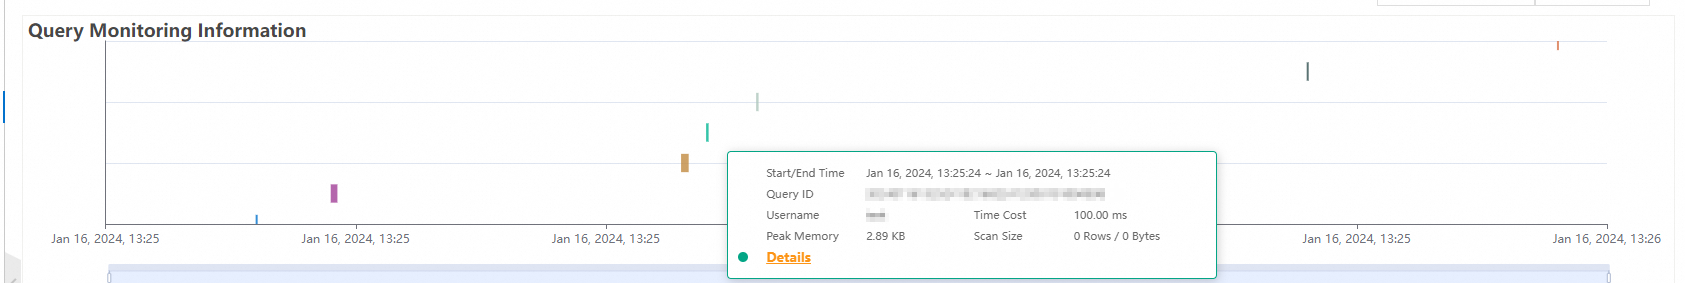
Method 1: In the Query Monitoring Information section, each colored bar in the trend chart represents one SQL query. Hover over a bar to see details such as the start or end time, then click Details.
-
Method 2: On the SQL Queries tab, click Diagnose in the Actions column for the query.

-
-
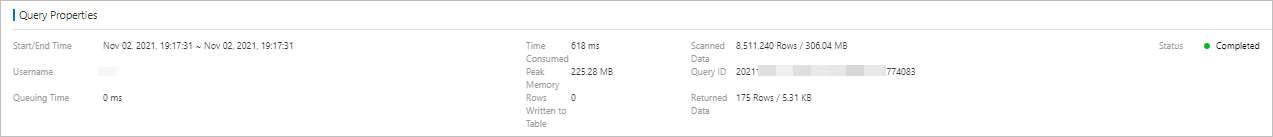
In the Query Properties section, review the execution status for the query, including Scanned Data, Returned Data, and Peak Memory. To return to the query monitoring page, click Back in the upper-right corner.
View diagnostic results
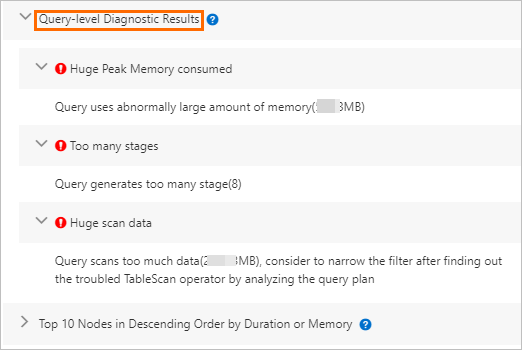
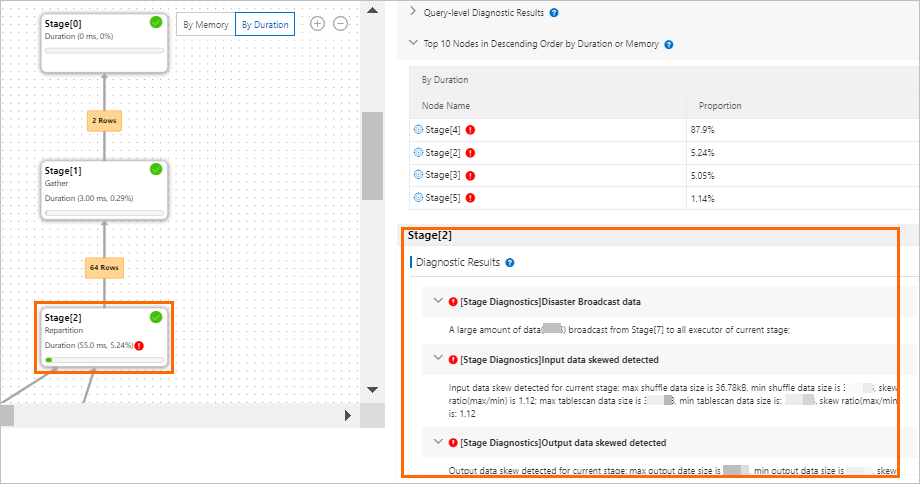
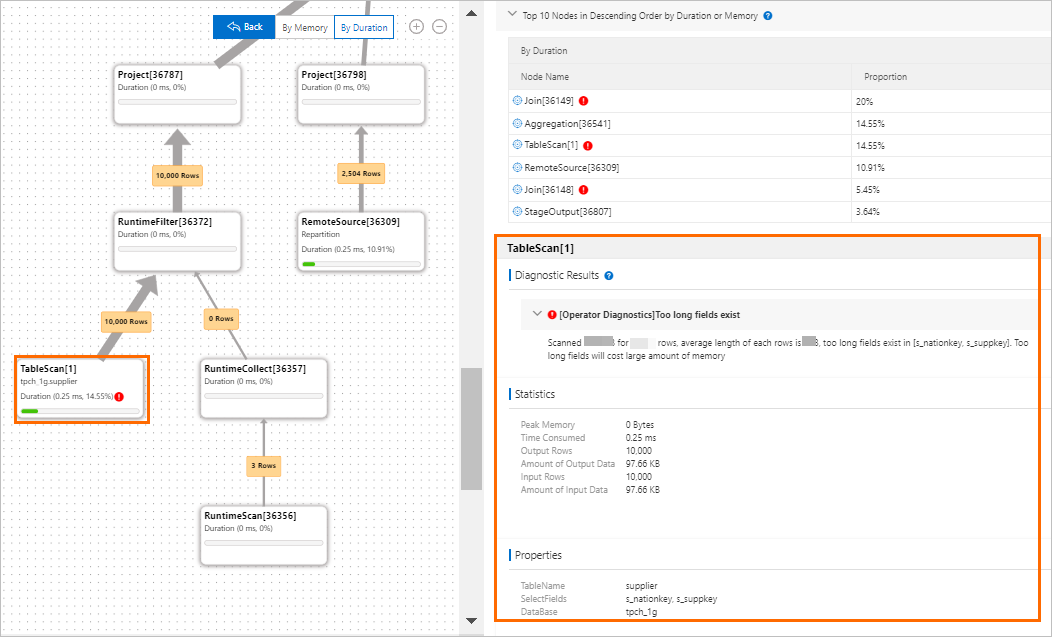
The Execution Plan tab shows a hierarchy chart that represents the execution plan as a tree of stages, where each stage breaks down into individual operators. Click any node in the chart to view its diagnostic results and optimization suggestions in the panel on the right.
| Level | How to select | Where results appear |
|---|---|---|
| Query | Click the Query-level Diagnostic Results tab on the right side of the hierarchy chart | Right panel |
| Stage | Click a stage node, such as Stage[2], in the hierarchy chart | Diagnostic Results section on the right |
| Operator | Hover over a stage, click View Stage Plans, then click an operator node such as TableScan[3] | Diagnostic Results section on the right |
To view diagnostic results:
-
Follow the steps in View query properties to open the query details page.
-
Click the Execution Plan tab to open the hierarchy chart.
-
View diagnostic results at the level you want to investigate:
-
Query level: On the right side of the hierarchy chart, click the Query-level Diagnostic Results tab. For details on interpreting each result, see Query-level diagnosis results.
-
Stage level: In the hierarchy chart, click a stage such as Stage[2]. The Diagnostic Results section on the right shows the results for that stage. For details, see Stage-level diagnostic results.
-
Operator level:
-
Hover over the stage and click View Stage Plans.
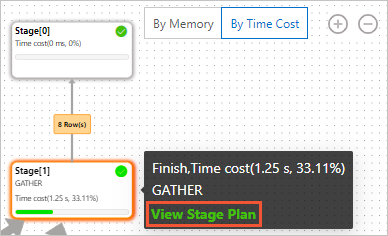
-
In the stage details page, click an operator such as TableScan[3]. The Diagnostic Results section shows the results for that operator. For details, see Operator-level diagnosis results.
-
-