AnalyticDB for MySQL provides the SQL diagnostics feature to separately collect statistics on SQL queries at the query, stage, and operator levels for diagnostics and deliver optimization suggestions. This topic describes how to view the properties of a specific query and diagnostic results at each level in the AnalyticDB for MySQL console.
Precautions
The SQL diagnostics feature is not supported for clusters that are created in the Germany (Frankfurt), UK (London), US (Silicon Valley), and US (Virginia) regions.
View query properties
Go to the SQL Diagnostics tab. For more information, see Go to the SQL Diagnostics tab.
In the upper-right corner of the SQL Diagnostics tab, select the general search conditions based on your business needs. For example, select Last 5 Minutes and Top 100 Most Time-consuming Queries.
In the search result chart, use one of the following methods to go to the query details page:
Method 1
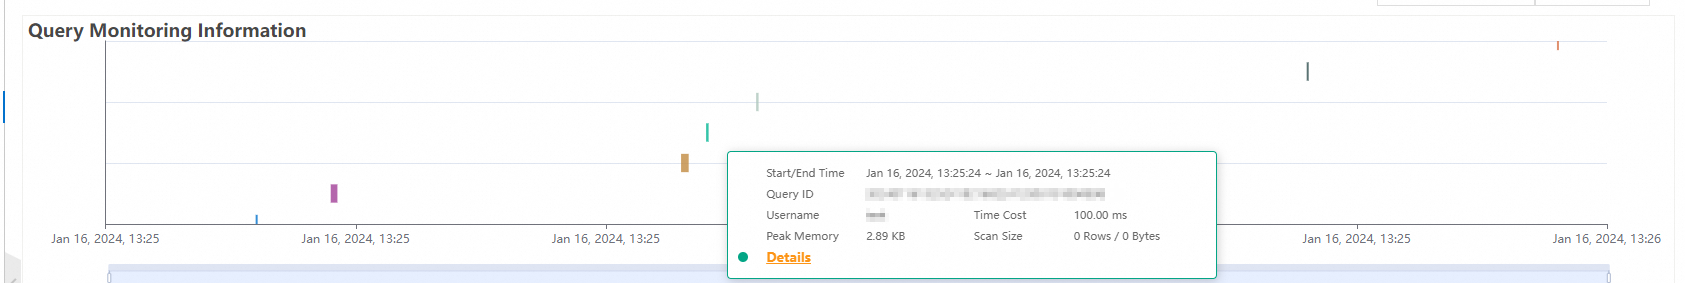
In the Query Monitoring Information section, each colored bar in the trend chart represents one SQL query. Move the pointer over the colored bar corresponding to a specific query to view details such as the start or end time. Click Details to go to the query details page.
Method 2
On the SQL Queries tab, click Diagnose in the Actions column corresponding to a specific query to go to the query details page.

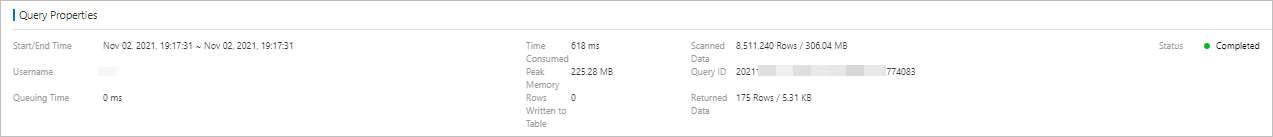
In the Query Properties section, view the execution status of a specific query statement, such as Scanned Data, Returned Data, and Peak Memory.
In the upper-right corner of the page, click Back to go to the query monitoring page to view other query-related information.
View diagnostic results
Repeat the steps in the "View query properties" section to go to the query details page.
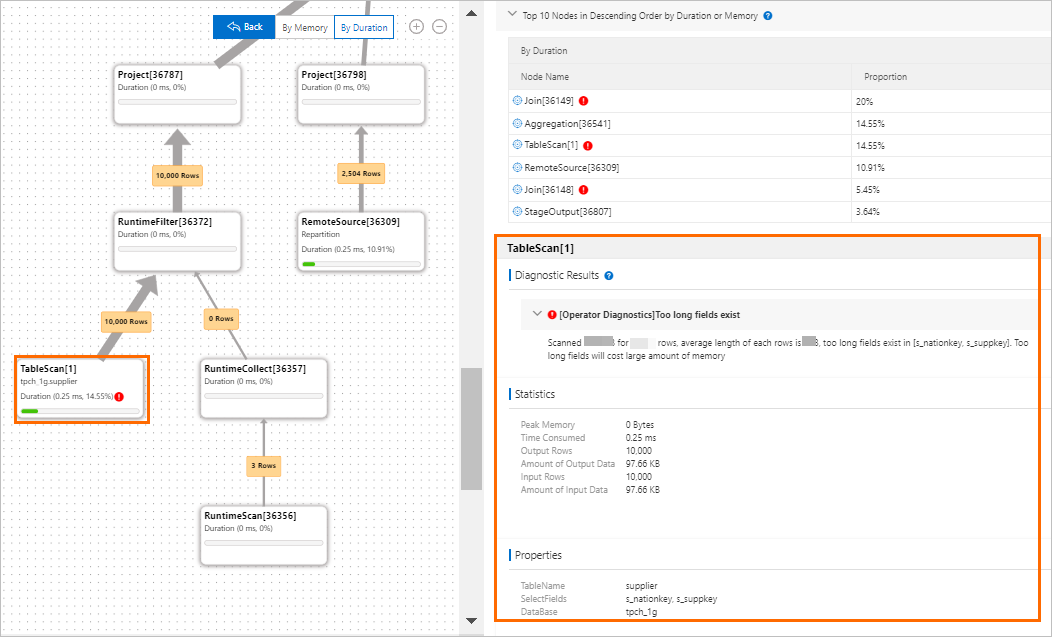
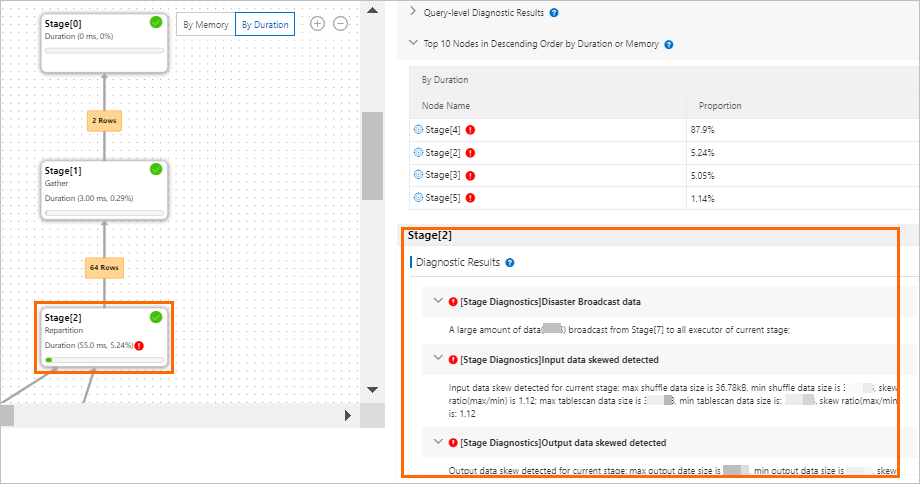
On the query details page, click the Execution Plan tab to view the hierarchy chart of the execution plan for a specific query. Use the hierarchy chart to view diagnostic results at the query, stage, and operator levels.
View query-level diagnostic results
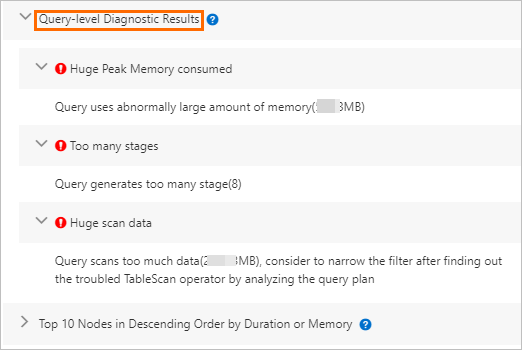
On the right side of the hierarchy chart, click the Query-level Diagnostic Results tab to view the details of the query-level diagnostic results. For more information, see Query-level diagnosis results.
View stage-level diagnostic results
Click a stage such as Stage[2] in the hierarchy chart to view the details in the Diagnostic Results section of the corresponding stage. For more information, see Stage-level diagnostic results.
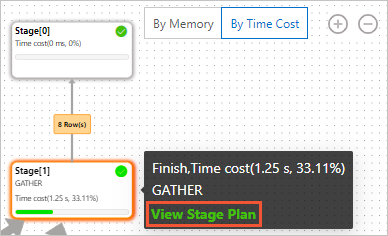
View operator-level diagnostic results
Move the pointer over the stage that you want to view and click View Stage Plans to go to the details page.
On the details page, click an operator such as TableScan[3] in the hierarchy chart to view the details in the Diagnostic Results section of the corresponding operator. For more information, see Operator-level diagnosis results.